CF stock forecast 2027–2029
MyStockButler's October 2026 analysis: CF's weighted forecast is $91.33 in October 2027, $102.66 in October 2028 and $117.23 in October 2029, with the base case carrying 55% probability. It hinges on fertilizer prices, shipments, plant reliability and Blue Point spending.
Where could CF's shares be by 2029?
The first weighted price is $91.33 in October 2027. Including dividends, that is a 22% loss from today’s $120.68. The second is $102.66 in October 2028, an 11% loss including dividends. The third is $117.23 in October 2029, a 3% gain including dividends.
By October 2029, the bear and bull outcomes span $70.57 to $212.71. The bear carries 25% probability. The base carries 55%, leaving 20% for the bull.
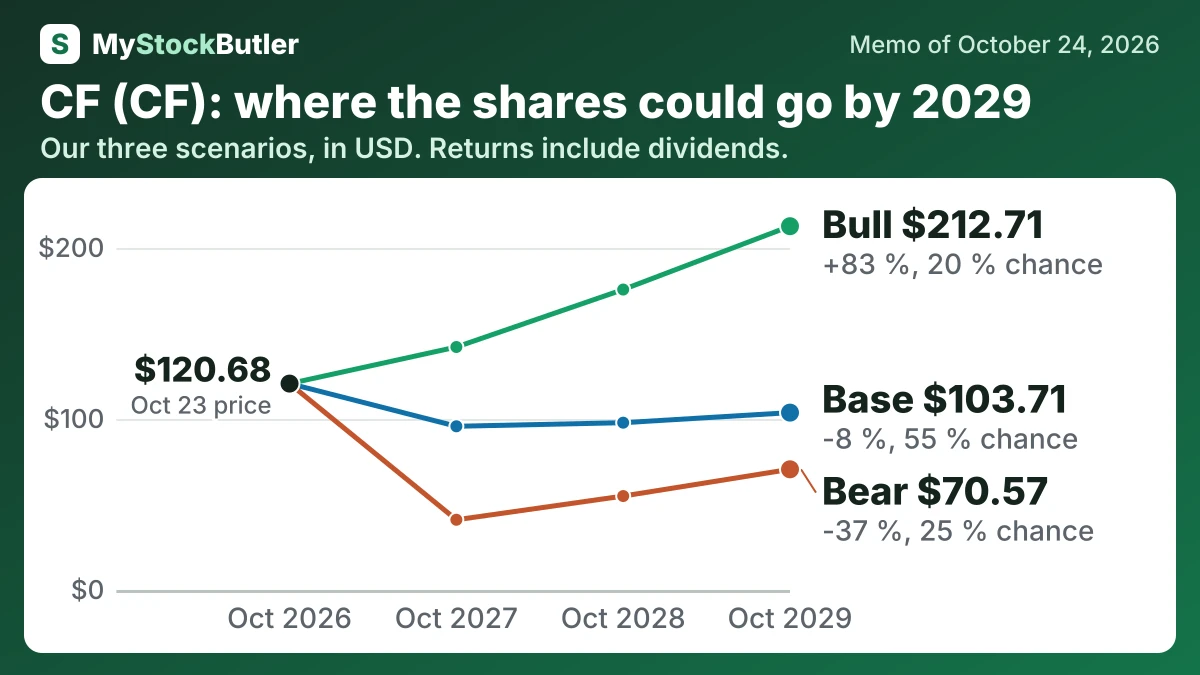
| Case | Probability | October 2027 | October 2028 | October 2029 |
|---|---|---|---|---|
| Bear | 25 % | 41.07 (-64 %) | 54.93 (-51 %) | 70.57 (-37 %) |
| Base | 55 % | 95.72 (-19 %) | 97.82 (-15 %) | 103.71 (-8 %) |
| Bull | 20 % | 142.07 (+20 %) | 175.67 (+50 %) | 212.71 (+83 %) |
| Weighted | 100 % | 91.33 (-22 %) | 102.66 (-11 %) | 117.23 (+3 %) |
What this means. The weighted row is the probability-based average of the bear, base, and bull cases, not a separate prediction, so it can be below today's share price.
What has to go right, and what could go wrong for CF?
The base case sets normal operating profit at $2,475 million in October 2027 and $2,336 million in October 2028. It reaches $2,294 million in October 2029. This sits above the $2,001 million average excluding 2022 but below current trailing earnings. The bear case starts at $1,495 million and recovers to $1,890 million as prices and volumes improve. The bull case rises from $3,237 million to $3,567 million because tight supply and strong utilization persist. Sales volume already fell 15%, while global nitrogen use is expected to decline 1–2%. CF nevertheless ran available ammonia capacity at 98%, and management expects 9.5 million tons of 2026 production.
How much cash does CF really make?
Operating cash flow was $2.752 billion in 2025. After $950 million of capital spending, free cash flow was $1.802 billion. Subtracting $45 million of stock compensation gives an analytical “real free cash flow” figure, because stock awards dilute owners even though they do not require the same immediate cash payment as wages.
| 2025 | 2024 | 2023 | 2022 | 2021 | |
|---|---|---|---|---|---|
| Cash from operations | 2,752 | 2,271 | 2,757 | 3,855 | 2,873 |
| − Capital spending | 950 | 518 | 499 | 453 | 514 |
| = Free cash flow | 1,802 | 1,753 | 2,258 | 3,402 | 2,359 |
| − Stock pay | 45 | 36 | 37 | 41 | 30 |
| = Real free cash flow | 1,757 | 1,717 | 2,221 | 3,361 | 2,329 |
What this means. The company's count is different because it subtracts cash paid to other owners of parts of the business, while our count subtracts the value of shares given to employees.
What does an investor pay for CF today?
At US$120.68 a share on October 24, 2026, investors value CF’s common shares at about US$18.3 billion. Its trailing P/E is 8.9x, while its forward P/E is 10.6x. That increase matters because the forward multiple implies lower earnings. A P/E is the share price divided by earnings, so it looks cheap when profits are temporarily high. Imagine a lemonade stand whose normal annual profit is US$10. If a hot week temporarily doubles that profit, a US$100 price looks cheaper than it really is.
| Today (Oct 24, 2026) | |
|---|---|
| Share price | 120.68 |
| Market value (calculated) | 18,263.49 |
| Enterprise value (calculated) | 18,999.49 |
| P/E, last 12 months (calculated) | 8.9x |
| P/E, next 12 months (calculated) | 10.6x |
| Real free cash flow yield (calculated) | 9.6% |