Mosaic dividend: cash coverage and yield
MyStockButler's October 2026 analysis: Mosaic pays $0.88 through 2028 in the base case, then $0.96. Its dividend is not covered by current free cash flow: in 2025, free cash flow was negative while dividends continued.
How much does Mosaic pay per share?
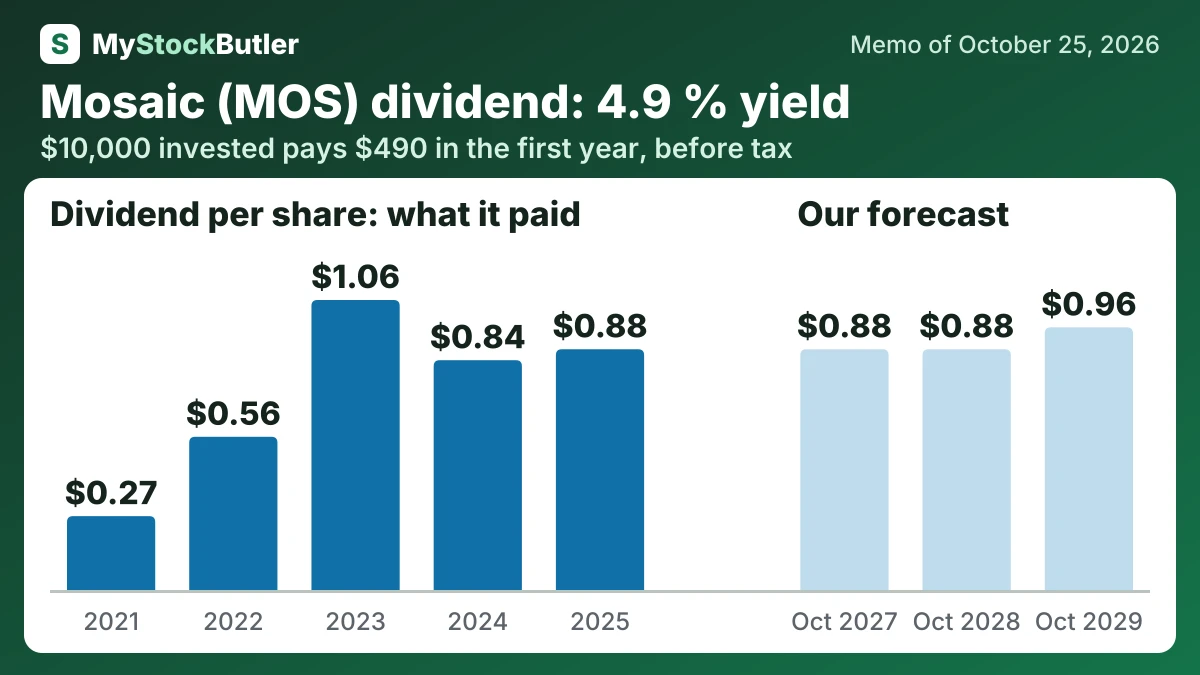
Dividends remain flat initially because free cash flow was negative in 2025 and in the first half of 2026. The base case pays $0.88 through 2028, then rises to $0.96. The bear case cuts that run rate to $0.44, then $0.22, and finally zero. The bull case holds $0.88 first, then increases it to $1.00 and $1.12 as cash generation improves. Capital spending and environmental commitments make the bear cuts credible.
| October 2027 | October 2028 | October 2029 | |
|---|---|---|---|
| Normal operating profit | 1,100 (400 / 1,800) | 1,500 (650 / 2,400) | 1,700 (850 / 2,800) |
| Dividends per share | 0.88 (0.44 / 0.88) | 0.88 (0.22 / 1.00) | 0.96 (0.00 / 1.12) |
| Net debt | 5,565 (6,465 / 4,828) | 5,411 (7,071 / 3,871) | 5,067 (7,419 / 2,726) |
How much would Mosaic's dividend pay you?
$10,000 invested in Mosaic at its 4.9% dividend yield (our report of October 25, 2026) pays $490.00 in the first year, before tax. If its dividend per share keeps changing 34.4% a year, as it did from 2021 to 2025, and the dividends are reinvested, year 10 pays $36,455.08, with $78,579.88 received in all.
Before tax. Past dividend growth is not a promise. Information only, not investment advice.
Does Mosaic's cash cover its dividend?
The discipline weakened afterward. Distributions exceeded free cash flow in 2023 and 2024. In 2025, buybacks stopped, but dividends continued even while free cash flow was negative. Mosaic could fund them from cash on hand, borrowing, asset sales or other financing, but those dividends were no longer paid from that year’s operating surplus.
In 2025, operating cash failed to cover capital spending, leaving free cash flow negative. The main operating drag was working capital: Mosaic bought and held more finished product, rock and sulfur before collecting cash from customers. Inventory may later release cash, but a weak market can force the company to sell it at a poor margin.
| 2025 | 2024 | 2023 | 2022 | 2021 | |
|---|---|---|---|---|---|
| Free cash flow | -534.6 | 47.4 | 1,004.8 | 2,688.5 | 898.4 |
| − Dividends paid | 280.4 | 270.7 | 351.6 | 197.7 | 103.7 |
| − Share buybacks | 0 | 235.4 | 756.0 | 1,665.2 | 410.9 |
| = Free cash flow not paid out | 787.6 | 352.5 | |||
| Paid out, % of free cash flow | not meaningful | 1067.7% | 110.2% | 69.3% | 57.3% |
What this means. In 2025, the company paid shareholders more cash than its business generated, so it had to rely on borrowing and other cash sources.
What could change Mosaic's dividend?
Mosaic’s share price could rise substantially by October 2029, but only if sulfur supply, plant utilization, Brazilian collections and cash generation recover. Management expects 9.0 million tonnes of potash production and $1.2 billion of capital expenditure for full-year 2026, while phosphate production guidance is withdrawn. For the third quarter of 2026, it guides to 1.1–1.4 million tonnes of phosphate sales and 2.0–2.2 million tonnes of potash sales. It also guides to $350 million of 2026 cash spending on asset-retirement obligations and environmental reserves.
The first signal would be sulfur availability and cost through October 2027. Improving phosphate margins despite stable DAP prices would move the forecast toward the bull case; continued negative margins would support the bear case.
What is Mosaic's dividend yield against its share price?
| Today (Oct 25, 2026) | |
|---|---|
| Share price | 17.84 |
| Market value (calculated) | 5,671.3 |
| Enterprise value (calculated) | 11,233.0 |
| Free cash flow yield (calculated) | -9.4% |
| Dividend yield (calculated) | 4.9% |
What this means. The company is paying a dividend even though its recent free cash flow was negative, meaning its business did not generate enough cash to cover that payment.