Martin Marietta earnings: guidance and results
MyStockButler's October 2026 analysis: Martin Marietta's next results are expected on November 4, 2026. Watch whether integration savings become cash that reduces debt.
What has Martin Marietta guided for 2026?
For 2026, management guides to revenue of $7,200–$7,400 million. Adjusted EBITDA guidance is $2,360–$2,500 million. Aggregates organic volume growth is guided at 1.0–3.0%. Organic selling-price growth is guided at 4.0–6.0%. Planned capital expenditures are $550–$600 million, which must still maintain quarry capacity.
| Period guided | Low | High | Date given | |
|---|---|---|---|---|
| Revenues | Year to Dec 2026 | 7,200 | 7,400 | Jul 30, 2026 |
| Adjusted EBITDA from continuing operations | Year to Dec 2026 | 2,360 | 2,500 | Jul 30, 2026 |
| Capital expenditures | Year to Dec 2026 | 550 | 600 | Apr 30, 2026 |
| Aggregates: Organic volume % growth | Year to Dec 2026 | 1.0% | 3.0% | Apr 30, 2026 |
| Aggregates: Organic ASP % growth | Year to Dec 2026 | 4.0% | 6.0% | Apr 30, 2026 |
What this means. The rows showing the same number in the low and high columns are single midpoint estimates, not a promise that results will fall within a range.
Has Martin Marietta kept its past promises?
An outside construction-spending forecast points to weaker demand in 2026, so execution matters. Management’s record is mixed: adjusted EBITDA finished below its initial range twice, within it once and above it once across the checked years. The company also exceeded its capital-spending guidance in three of five checked years. The promises deserve a measured, not automatic, level of trust.
| What management forecast | Checked | Above | Within | Below |
|---|---|---|---|---|
| Adjusted EBITDA | 4 years | 1 | 1 | 2 |
| Gross profit — Aggregates; initially called Product gross profit in FY2023 | 4 years | 0 | 2 | 2 |
| Capital expenditures | 5 years | 3 | 0 | 2 |
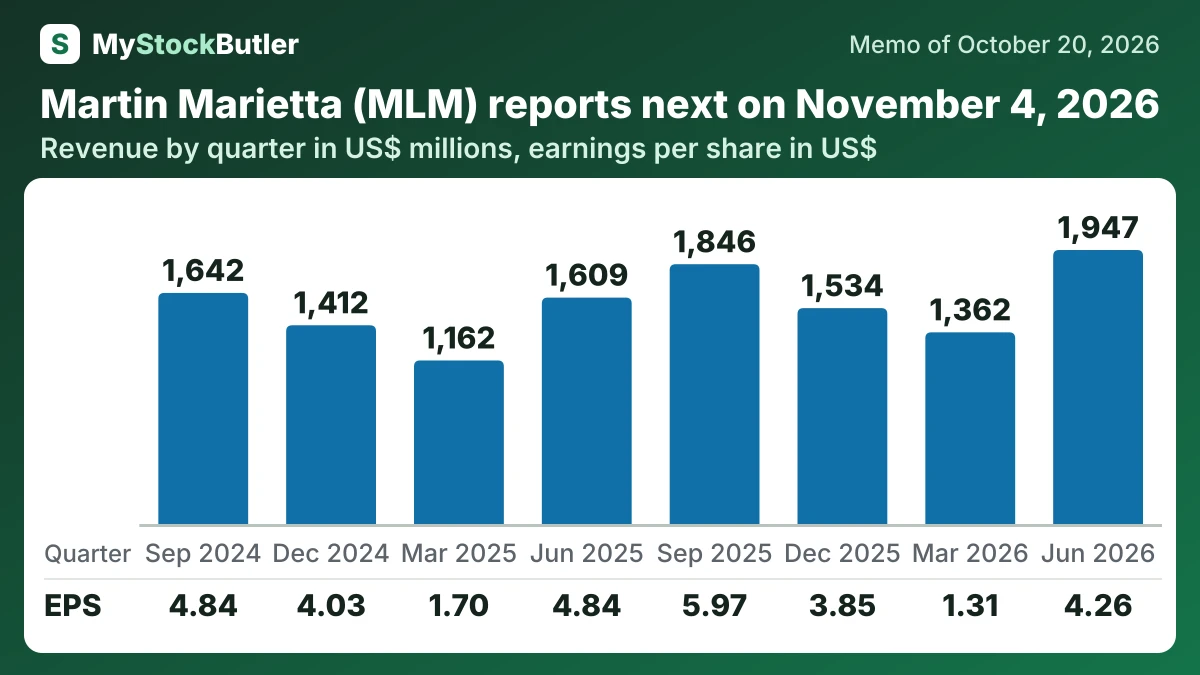
What have Martin Marietta's revenue and profit done in the last eight quarters?
Revenue rose to $1,947 million from $1,609 million in June 2025. Operating income fell to $372 million from $413 million. Diluted EPS fell to $4.26 from $4.84. Gross margin also declined, so the quarter cannot be read as broad profit recovery.
| Jun 2026 | Mar 2026 | Dec 2025 | Sep 2025 | Jun 2025 | Mar 2025 | Dec 2024 | Sep 2024 | |
|---|---|---|---|---|---|---|---|---|
| Revenue | 1,947 | 1,362 | 1,534 | 1,846 | 1,609 | 1,162 | 1,412 | 1,642 |
| Gross margin | 25.4% | 22.8% | 30.5% | 33.1% | 30.8% | 27.1% | 30.0% | 31.2% |
| Operating income | 372 | 162 | 341 | 505 | 413 | 179 | 339 | 406 |
| Net income | 256 | 79 | 233 | 361 | 292 | 104 | 248 | 297 |
| EPS, diluted | 4.26 | 1.31 | 3.85 | 5.97 | 4.84 | 1.70 | 4.03 | 4.84 |
| = Free cash flow | 105 | 5 | 372 | 338 | 174 | -4 | 400 |
What this means. The older numbers were changed to remove businesses the company sold, so they may differ from earlier reports but can be compared fairly with newer numbers.
What should I watch in Martin Marietta's next results?
2027 is the first full calendar year after closing. Management expects the transaction to improve earnings and margins, excluding specified transaction and purchase-accounting effects. The question is whether that improvement survives the added interest and share count. The existing-business program should also approach its annual cash-improvement pace as Martin Marietta exits 2027.
By approximately August 2028, management targets $85 million of annual cost synergies and net leverage below 2.5 times. That “run rate” is the pace reached by then, not the cumulative cash saved during the preceding period. Investors should connect the milestones: savings should lower costs, operating gains should become cash after investment and taxes, and that cash should reduce debt. If earnings rise while inventory, capital spending and borrowings remain high, the balance-sheet repair is taking longer than the headline results suggest.