Martin Marietta stock forecast 2027–2029
MyStockButler's October 2026 analysis: The weighted forecast values Martin Marietta's shares at $406.52 in October 2029, an 18% loss including dividends. Martin Marietta's forecast hinges on Lhoist savings, cash generation and debt reduction.
Where could Martin Marietta's shares go?
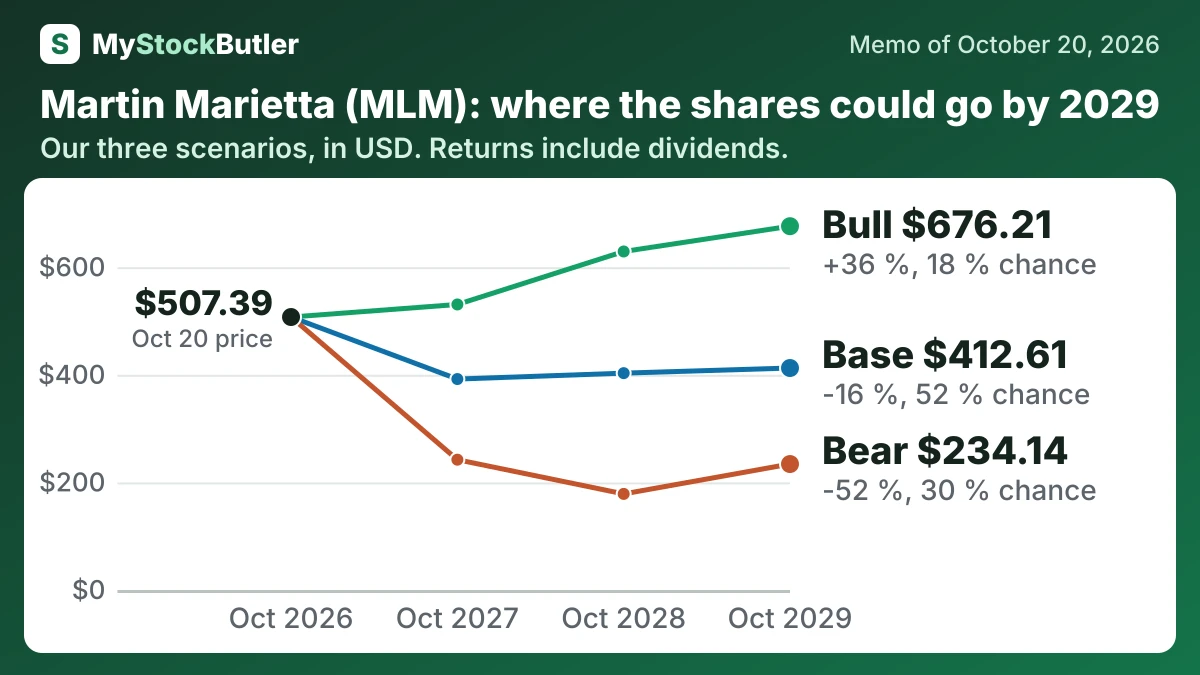
The weighted forecast values the shares at $372.07 in October 2027, a 26% loss including dividends. It reaches $406.52 in October 2029, an 18% loss. Bear probability is 30%. Base probability is 52%, and bull probability is 18%.
| Case | Probability | October 2027 | October 2028 | October 2029 |
|---|---|---|---|---|
| Bear | 30 % | 242.20 (-52 %) | 178.60 (-63 %) | 234.14 (-52 %) |
| Base | 52 % | 392.08 (-22 %) | 403.07 (-19 %) | 412.61 (-16 %) |
| Bull | 18 % | 530.73 (+5 %) | 629.21 (+26 %) | 676.21 (+36 %) |
| Weighted | 100 % | 372.07 (-26 %) | 376.44 (-24 %) | 406.52 (-18 %) |
What has to go right or wrong for Martin Marietta?
Normal operating profit is the central earnings judgment. The base case rises from $2,100 million to $2,300 million because Q2 organic shipments grew 2.3%, while mix-adjusted prices rose 3.7% against 2.1% cost growth. It also assumes a growing Lhoist contribution and gradual integration savings. The bear case falls to $1,750 million before recovering because housing and project delays pressure volume. The bull case reaches $2,700 million if demand broadens and savings arrive quickly. Management’s 2026 adjusted EBITDA guidance implies an operating-profit anchor near $1,630 million after DDA, supporting caution around the base.
| October 2027 | October 2028 | October 2029 | |
|---|---|---|---|
| Normal operating profit | 2,100 (1,850 / 2,250) | 2,200 (1,750 / 2,500) | 2,300 (1,850 / 2,700) |
| Shares (millions) | 70.93 (71.12 / 70.55) | 70.85 (71.22 / 70.12) | 70.79 (71.32 / 69.72) |
| Dividends per share | 3.56 (3.40 / 3.72) | 3.92 (3.40 / 4.46) | 4.31 (3.40 / 5.35) |
| Enterprise value to normal operating profit | 19.00 (16.00 / 22.00) | 18.00 (14.00 / 22.00) | 17.00 (15.00 / 21.00) |
| Net debt | 12,089 (12,375 / 12,055) | 11,041 (11,780 / 10,881) | 9,893 (11,051 / 9,556) |
How much cash does Martin Marietta really make?
Capital spending then takes a large share. Martin Marietta spent $718 million on capital equipment in 2025. That left $880 million of free cash flow. After allowing for $46 million of stock compensation, the analytical “real free cash flow” was $834 million. This is not a second cash payment; it recognizes that employees were paid partly with an ownership claim.
| 2025 | 2024 | 2023 | 2022 | 2021 | |
|---|---|---|---|---|---|
| Cash from operations | 1,598 | 1,227 | 1,307 | ||
| − Capital spending | 718 | 755 | 548 | ||
| = Free cash flow | 880 | 472 | 759 | ||
| − Stock pay | 46 | 58 | 50 | 43 | 43 |
| = Real free cash flow | 834 | 414 | 709 | ||
| Real free cash flow, % of revenue | 13.6% | 7.3% | 12.1% |
What this means. Real free cash flow subtracts share-based pay even though no cash was paid, because employees received part of the company instead.
What does an investor pay today for Martin Marietta?
The stock was $507.39 on October 20, 2026. Its trailing P/E was 33.0x and forward P/E 24.1x. Free cash flow yield was 2.4%, and dividend yield was 0.7%. Revenue rose 8.6% in 2025 while aggregates shipments were 198.5 million tons. The 2024 operating-margin spike includes a $1,331 million disposal gain. The company’s real free cash flow recovered to 13.6% of revenue in 2025 from 7.3% in 2024. Net debt rose to $5,558 million in 2025.