Lululemon earnings date and guidance
MyStockButler's October 2026 analysis: Lululemon's next results are expected on December 10, 2026. Watch whether new products restore North American comparable sales and full-price selling.
What has Lululemon guided for fiscal 2026?
Guidance is the company’s forecast, not a guaranteed result. On September 3, 2026, lululemon reduced its fiscal 2026 revenue outlook to $10.35–10.50 billion and diluted earnings per share, or EPS, to $9.48–9.73. Revenue is money collected from customers; EPS is profit divided among shares, including potentially dilutive awards.
The next quarter looks especially difficult. Third-quarter revenue guidance is $2.29–2.32 billion, with diluted EPS of $0.93–0.98. The annual EPS range also includes a $0.86 benefit from tariff refunds and related interest recorded in the second quarter. That is real money, but it reflects repayment of earlier import charges, not stronger clothing demand.
| Period guided | Low | High | Date given | |
|---|---|---|---|---|
| Net revenue — fiscal year | Fiscal 2026 (year to Jan 2027) | 10,350 | 10,500 | Sep 3, 2026 |
| Diluted earnings per share — fiscal year | Fiscal 2026 (year to Jan 2027) | 9.48 | 9.73 | Sep 3, 2026 |
| Net revenue — third quarter | Third quarter fiscal 2026 | 2,290 | 2,320 | Sep 3, 2026 |
| Diluted earnings per share — third quarter | Third quarter fiscal 2026 | 0.93 | 0.98 | Sep 3, 2026 |
| Capital expenditures | Fiscal 2026 (year to Jan 2027) | |||
| New company-operated stores | Fiscal 2026 (year to Jan 2027) |
What this means. The fiscal-year earnings-per-share forecast includes money from tariff refunds and interest, so it may look higher than the company's normal earnings.
Did Lululemon keep its past promises?
The company’s record deserves a mixed assessment. Over eight quarters, EPS exceeded management’s range eight times, while revenue exceeded it six times and missed twice. Longer-term promises have been less reliable: full-year revenue and EPS guidance fell in June and September 2026 after earlier reductions. The recovery therefore still has to prove itself through sales.
| What management forecast | Checked | Above | Within | Below |
|---|---|---|---|---|
| Net revenue | 8 quarters | 6 | 0 | 2 |
| Diluted earnings per share | 8 quarters | 8 | 0 | 0 |
| Tax rate | 8 quarters | 4 | 1 | 3 |
What this means. The three out of five score is unclear because the table lists only three forecast types and does not explain what the five means.
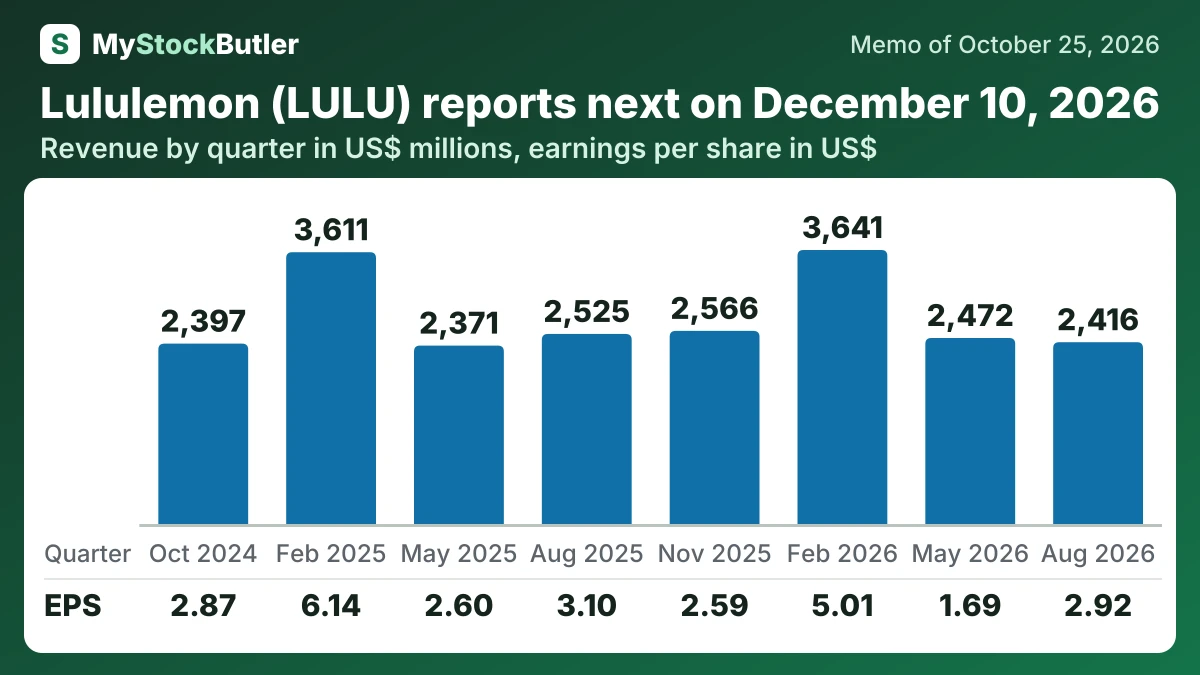
What have Lululemon's last eight quarters shown?
Revenue fell approximately 4.3% year over year in the quarter, after approximately 4.3% growth in the preceding quarter. Comparable sales fell 9%, or 10% in constant currency. Americas comps fell 12%, while international comps fell 6% in constant currency. New stores and other channels softened the total-sales decline, but they did not restore demand at established locations.
Reported gross margin rose even as operating income and net income fell. The tariff refund contributed $134.5 million, and removing its disclosed benefit cut quarterly EPS by $0.86. A temporary recovery from invalidated tariffs is not evidence that customers are buying more products at full price.
| Aug 2026 | May 2026 | Feb 2026 | Nov 2025 | Aug 2025 | May 2025 | Feb 2025 | Oct 2024 | |
|---|---|---|---|---|---|---|---|---|
| Revenue | 2,415,631 | 2,471,603 | 3,640,801 | 2,565,920 | 2,525,219 | 2,370,660 | 3,611,497 | 2,396,660 |
| Gross margin | 60.5% | 54.2% | 54.9% | 55.6% | 58.5% | 58.3% | 60.4% | 58.5% |
| Operating income | 453,653 | 276,946 | 812,290 | 435,886 | 523,814 | 438,625 | 1,042,168 | 490,661 |
| Net income | 329,223 | 195,048 | 586,871 | 306,835 | 370,905 | 314,572 | 748,403 | 351,870 |
| EPS, diluted | 2.92 | 1.69 | 5.01 | 2.59 | 3.10 | 2.60 | 6.14 | 2.87 |
| = Free cash flow | 225,162 | 87,060 | 959,671 | 82,443 | 150,778 | -271,217 | 1,166,408 | 122,176 |
What this means. The August 2026 profit and gross margin look higher because they include 134.5 million dollars in tariff refunds, which are not normal business earnings.