Adidas stock forecast 2027–2029
MyStockButler's October 2026 analysis: Adidas’s weighted forecast is €191.66 in October 2027 and €237.64 in October 2029, with bear, base and bull probabilities of 30%, 52% and 18%. It hinges on Adidas turning product momentum into durable, cash-generating growth.
Where could Adidas’s shares be by 2029?
The weighted path is €191.66 in October 2027 and €219.19 in October 2028. It reaches €237.64 in October 2029, producing a 48% total return including dividends from today's €168.55. The final range runs from €90.41 in the bear case to €433.28 in the bull case. The bear probability is 30%. The base probability is 52%. The bull probability is 18%.
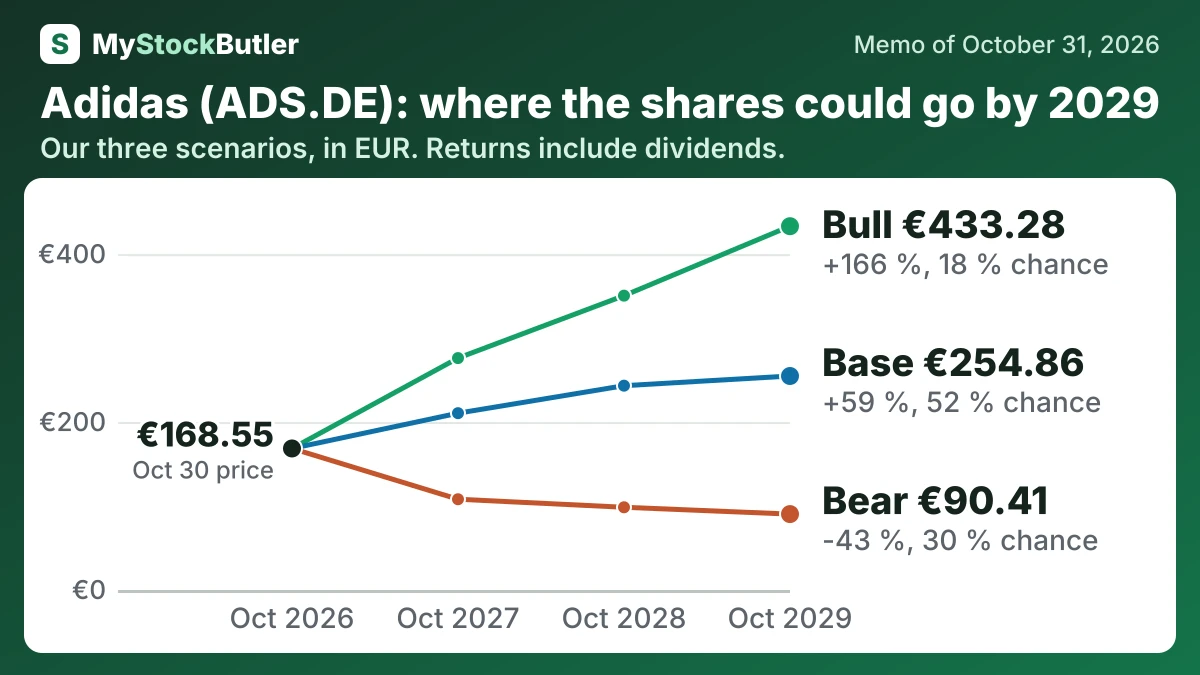
| Case | Probability | October 2027 | October 2028 | October 2029 |
|---|---|---|---|---|
| Bear | 30 % | 108.09 (-34 %) | 98.51 (-39 %) | 90.41 (-43 %) |
| Base | 52 % | 210.60 (+27 %) | 243.35 (+49 %) | 254.86 (+59 %) |
| Bull | 18 % | 276.22 (+66 %) | 350.56 (+113 %) | 433.28 (+166 %) |
| Weighted | 100 % | 191.66 (+16 %) | 219.19 (+34 %) | 237.64 (+48 %) |
What has to go right for Adidas, and what could go wrong?
Base earnings rise from €1,960 million in 2027 to €2,447 million in 2029. Revenue rises from €27.6 billion to €32.2 billion. Net margin rises from 7.1% to 7.6%. The path reflects management's high-single-digit sales ambition and operating margin above 10% in 2028, while excluding tariff refunds and exceptional items. The bear case gives €1,554 million in 2027 and €1,562 million in 2029 because post-World-Cup demand cools, discounts persist and working capital remains heavy. The bull case gives €2,100 million and €2,864 million because Performance and apparel growth hold, lifestyle markdowns ease and operating leverage exceeds target.
How much cash does Adidas really make?
Free cash flow goes beyond operating cash. The calculation used here deducts purchases of property, plant and equipment, lease payments, and interest paid; it excludes purchases of intangible assets. On that basis, free cash flow was negative €475 million in 2025, compared with positive €1.6 billion in 2024. A more conservative version also deducts stock-based pay and reached negative €558.6 million. That is an analytical adjustment, not a separately audited cash-flow line.
| 2025 | 2024 | 2023 | 2022 | 2021 | |
|---|---|---|---|---|---|
| = Free cash flow | -475 | 1,618 | 1,421 | -1,669 | 1,696 |
| − Stock pay | 83.6 | 93.6 | 72.7 | 43.6 | 59.7 |
| = Real free cash flow | -558.6 | 1,524.4 | 1,348.3 | -1,712.6 | 1,636.3 |
| Real free cash flow, % of revenue | -2.3% | 6.4% | 6.3% | -7.6% | 7.7% |
What this means. Stock pay uses no cash today, but it still reduces real free cash flow because employees receive part of the company.
What does an investor pay for Adidas today?
The price-to-earnings ratio, or P/E, says how much investors pay for each euro of annual profit attributable to one share. A trailing P/E uses the past twelve months; a forward P/E uses an estimate of the next twelve. The forward multiple implies roughly €11.70 of expected earnings per share, and its inverse is an earnings yield of about 6.9%. That is an accounting comparison, not a promised cash return.
| Today (Oct 30, 2026) | |
|---|---|
| Share price | 168.55 |
| Market value (calculated) | 29,059.83 |
| P/E, next 12 months (calculated) | 14.4x |
| Free cash flow yield (calculated) | -1.6% |
| Real free cash flow yield (calculated) | -1.9% |
What this means. The negative free cash flow yield means the company spent more cash than it generated during the year.