Lululemon stock forecast 2027–2029
MyStockButler's October 2026 analysis: The weighted forecast is $95.07 in the first year, a 4% loss including dividends. The bear story is that the North American reset fails to replace declining leggings demand.
Where could Lululemon's shares be by October 2029?
The forecast starts cautiously but becomes constructive over three years. The weighted price is $95.07 in the first year, a 4% loss including dividends. It reaches $124.75 in the second year, a 26% gain. By the third year, it reaches $161.07, a 63% gain.
The range is unusually wide: $54.71 in the bear case to $349.31 in the bull case by October 2029, against today’s $99.01. The base case receives 47%. The bear case receives 35%, while the bull case receives 18%.
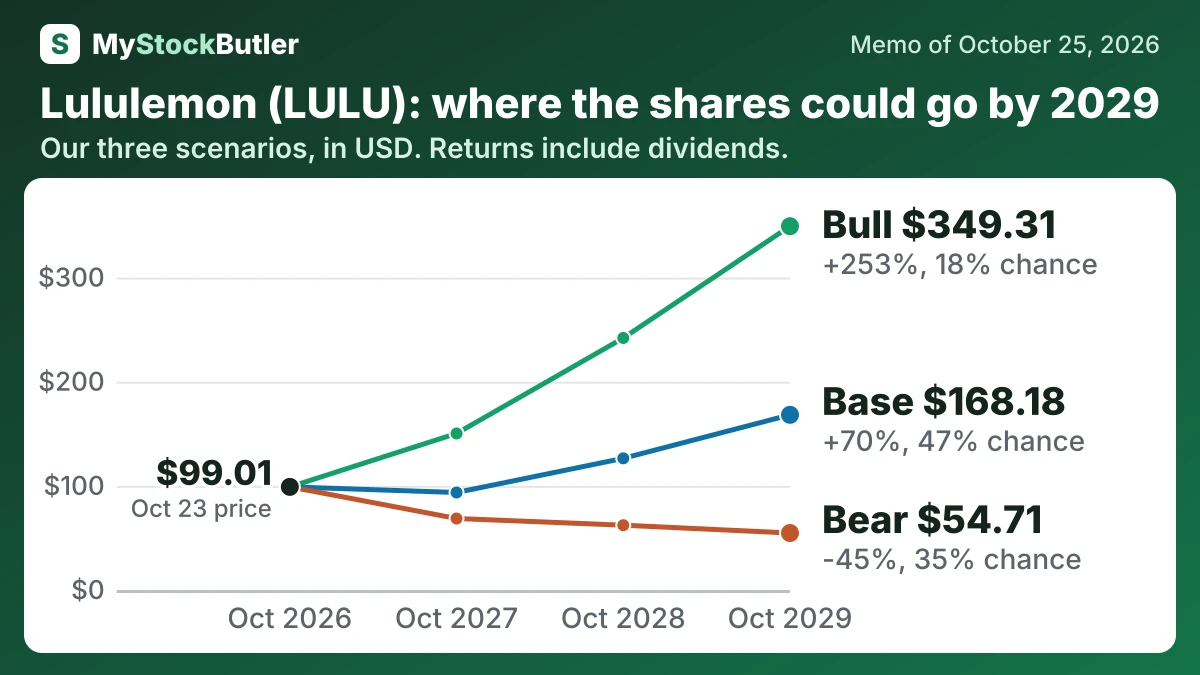
| Case | Probability | October 2027 | October 2028 | October 2029 |
|---|---|---|---|---|
| Bear | 35% | 68.63 (-31%) | 62.21 (-37%) | 54.71 (-45%) |
| Base | 47% | 93.61 (-5%) | 126.43 (+28%) | 168.18 (+70%) |
| Bull | 18% | 150.29 (+52%) | 241.98 (+144%) | 349.31 (+253%) |
| Weighted | 100% | 95.07 (-4%) | 124.75 (+26%) | 161.07 (+63%) |
What has to go right or wrong for Lululemon?
The bear story is that the North American reset fails to replace declining leggings demand. New stores cannot offset weaker established sales, while markdowns and trade costs keep margins depressed. Buybacks consume cash without repairing demand, so earnings and the multiple fall together. The path leads from $68.63 to $54.71 and receives 35%. Broad negative comps and two outlook cuts make this credible, although cash and no debt reduce distress risk.
How much cash does Lululemon really make?
Free cash flow subtracts capital spending on stores, technology and distribution centres from operating cash flow. Stock compensation then deserves a separate deduction because issuing shares is not an immediate cash payment, but it dilutes existing owners unless offset. The resulting “real” free cash flow is an analytical measure, not a company subtotal.
| Feb 2026 | Feb 2025 | Jan 2024 | Jan 2023 | Jan 2022 | |
|---|---|---|---|---|---|
| Cash from operations | 1,602,477 | 2,272,713 | 2,296,164 | 966,463 | 1,389,108 |
| − Capital spending | 680,802 | 689,232 | 651,865 | 638,657 | 394,502 |
| = Free cash flow | 921,675 | 1,583,481 | 1,644,299 | 327,806 | 994,606 |
| − Stock pay | 62,203 | 90,011 | 93,560 | 78,075 | 69,137 |
| = Real free cash flow | 859,472 | 1,493,470 | 1,550,739 | 249,731 | 925,469 |
What this means. The working capital rows cover more than stock and unpaid customer bills; they also include taxes, long-term items, and leases.
What does an investor pay for Lululemon today?
The trailing P/E compares the share price with recent earnings; the forward P/E uses expected earnings. A low P/E can mean a bargain, but it can also mean investors expect profit to fall. Lululemon’s higher forward multiple therefore warns that the earnings denominator is weakening.
| Today (Oct 24, 2026) | |
|---|---|
| Share price | 99.01 |
| Market value (calculated) | 10,961,399.575 |
| P/E, last 12 months (calculated) | 8.1x |
| P/E, next 12 months (calculated) | 10.3x |
| Free cash flow yield (calculated) | 8.4% |
| Real free cash flow yield (calculated) | 7.8% |
What this means. Enterprise value is lower than market value because the company has more cash and short-term investments than debt.