Deckers stock forecast 2027–2029
MyStockButler's October 2026 analysis: Deckers' weighted price is $129.87 in October 2029. It hinges on successful HOKA launches, broader UGG demand, international growth, and full-price selling.
Where could Deckers' shares be by 2029?
The probability-weighted forecast points to moderate near-term upside and stronger returns over three years. The weighted price is $90.55 in October 2027, an 11% return with dividends. It reaches $108.28 in October 2028, a 33% return.
By October 2029, the weighted price is $129.87, a 59% return. The range then runs from $57.87 in the bear case to $218.01 in the bull case, against today’s $81.48. The spread reflects uncertainty over HOKA demand, UGG’s durability, margins, buybacks, and the valuation multiple.
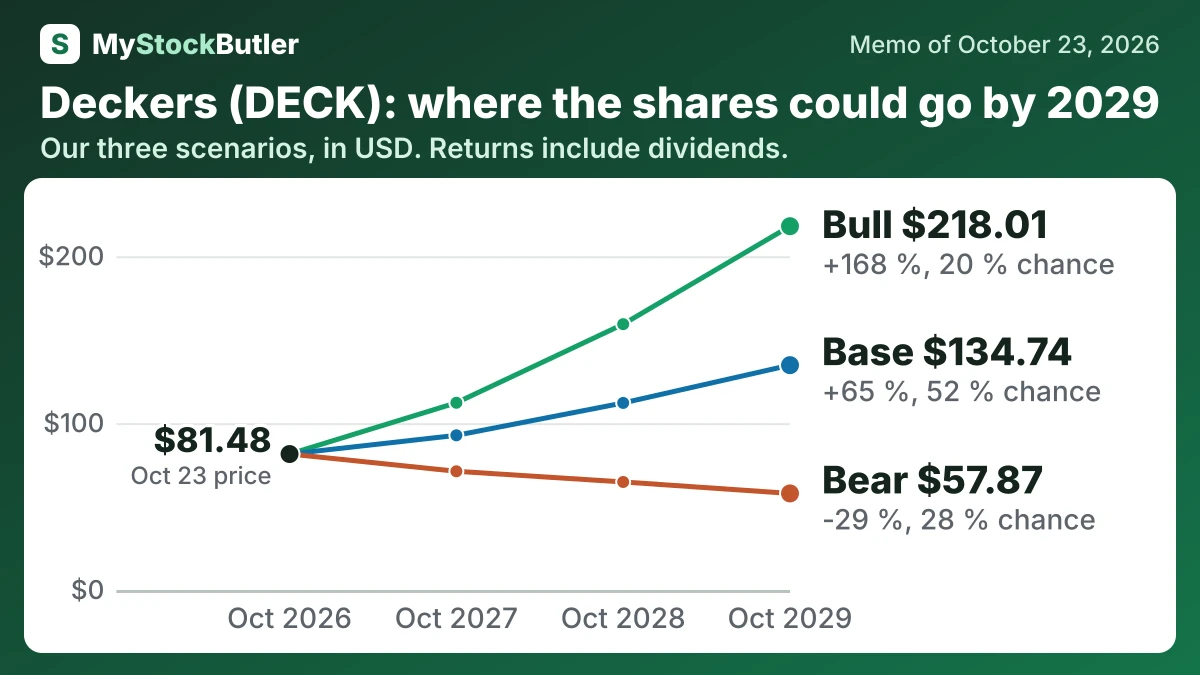
| Case | Probability | October 2027 | October 2028 | October 2029 |
|---|---|---|---|---|
| Bear | 28 % | 71.13 (-13 %) | 64.73 (-21 %) | 57.87 (-29 %) |
| Base | 52 % | 92.69 (+14 %) | 112.10 (+38 %) | 134.74 (+65 %) |
| Bull | 20 % | 112.20 (+38 %) | 159.29 (+95 %) | 218.01 (+168 %) |
| Weighted | 100 % | 90.55 (+11 %) | 108.28 (+33 %) | 129.87 (+59 %) |
What has to go right or wrong for Deckers?
The bear case gives earnings of $971 million, then $883 million, then $840 million. It assumes weak HOKA sell-through, markdowns, softer UGG demand, and margins falling from 17.5% to 16.0%. The bull case reaches $1,082 million, then $1,226 million, then $1,363 million because successful HOKA launches, broader UGG demand, international growth, and full-price selling lift both revenue and margins.
How much cash does Deckers really make?
Stock compensation complicates that picture. Accounting deducts it from earnings but adds it back to operating cash because issuing shares does not immediately use cash. Deducting $44.8 million of fiscal 2026 stock pay leaves analytical “real free cash flow” of about $1.1 billion. That is not Deckers’ own measure, but it recognizes possible dilution.
| Mar 2026 | Mar 2025 | Mar 2024 | Mar 2023 | Mar 2022 | |
|---|---|---|---|---|---|
| Cash from operations | 1,181,955 | 1,044,523 | 1,033,184 | 537,422 | 172,353 |
| − Capital spending | 84,623 | 86,171 | 89,365 | 81,025 | 51,017 |
| = Free cash flow | 1,097,332 | 958,352 | 943,819 | 456,397 | 121,336 |
| − Stock pay | 44,835 | 37,943 | 37,288 | 26,897 | 26,816 |
| = Real free cash flow | 1,052,497 | 920,409 | 906,531 | 429,500 | 94,520 |
| Real free cash flow, % of revenue | 19.2% | 18.5% | 21.1% | 11.8% | 3.0% |
What this means. Stock pay is not cash paid today, but we subtract it because giving employees shares reduces what existing shareholders own.
What does an investor pay for Deckers today?
Today’s price assumes Deckers can preserve its profits, but it does not require a return to rapid growth.
| Today (Oct 23, 2026) | |
|---|---|
| Share price (US$ per share) | 81.485 |
| Market value (calculated) | 11,096,778.618 |
| Enterprise value (calculated) | 9,887,056.618 |
| P/E, last 12 months (calculated) | 10.8x |
| P/E, next 12 months (calculated) | 10.7x |
| Real free cash flow yield (calculated) | 9.5% |
What this means. The enterprise value is lower than the market value because the company has more cash than debt.