Lennar stock forecast 2027–2029
MyStockButler's October 2026 analysis: Lennar’s weighted forecast puts the shares at $52.22 in October 2027 and $139.28 in October 2029. It hinges on Lennar’s operating profit recovering.
Where could Lennar's shares be in October 2029?
The weighted forecast puts the shares at $52.22 in October 2027, a −37% return including dividends. It reaches $139.28 in October 2029, a +70% total return including dividends. Bear probability is 35% and base probability is 50%. Bull probability is 15%.
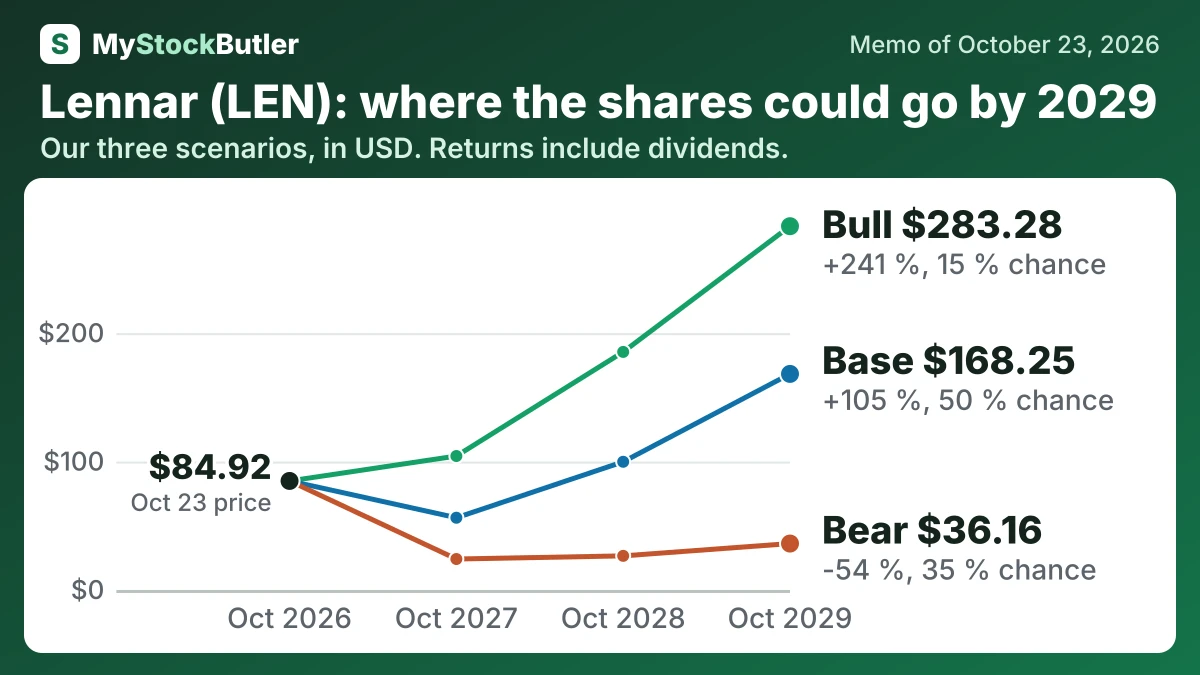
| Case | Probability | October 2027 | October 2028 | October 2029 |
|---|---|---|---|---|
| Bear | 35 % | 24.12 (-70 %) | 26.58 (-66 %) | 36.16 (-54 %) |
| Base | 50 % | 56.27 (-31 %) | 99.85 (+22 %) | 168.25 (+105 %) |
| Bull | 15 % | 104.32 (+25 %) | 185.37 (+123 %) | 283.28 (+241 %) |
| Weighted | 100 % | 52.22 (-37 %) | 87.03 (+6 %) | 139.28 (+70 %) |
What has to go right or wrong for Lennar?
Operating profit is the central assumption. The base case rises from $2,400M to $3,200M and then $4,300M. The bear case stays at $1,600M, $1,800M and $2,100M, while the bull case reaches $3,200M, $4,500M and $5,700M. The five-year average was $4,921M, but FY2025 fell to $2,668M. Recent evidence is mixed: Q3 homebuilding operating earnings were $502M, while orders fell 9%. Gross margin was 15.8%, below the prior year, so the base case assumes only partial recovery.
The bear case is a prolonged low-return housing cycle. Mortgage-payment pressure keeps orders weak, incentives defend volume, and land costs and write-downs prevent margin repair. Inventory and deposits continue consuming cash, limiting buybacks. The path leads from a share price of $24.12 in October 2027 to $36.16 in October 2029, excluding dividends. Its probability is 35% because Q3 orders declined 9% and gross margin was only 15.8%. Operating cash use and $3,147M of net debt add pressure.
| October 2027 | October 2028 | October 2029 | |
|---|---|---|---|
| Normal operating profit | 2,400 (1,600 / 3,200) | 3,200 (1,800 / 4,500) | 4,300 (2,100 / 5,700) |
| Shares (millions) | 234 (238 / 229) | 230 (238 / 221) | 227 (238 / 215) |
| Dividends per share | 2.00 (1.00 / 2.00) | 2.00 (1.00 / 2.20) | 2.00 (1.00 / 2.40) |
| Enterprise value to normal operating profit | 7.00 (6.00 / 8.50) | 8.00 (5.50 / 9.50) | 9.00 (5.50 / 10.50) |
| Net debt | 3,641 (3,857 / 3,325) | 2,627 (3,565 / 1,730) | 577 (2,929 / -994) |
How much cash does Lennar really make?
Free cash flow subtracts capital spending from operating cash. Deducting stock compensation as an economic cost goes further: the award does not consume cash immediately, but it gives employees a claim on the company. Lennar’s resulting real free cash flow turned negative in 2025 after being positive in earlier years.
| Nov 2025 | Nov 2024 | Nov 2023 | Nov 2022 | Nov 2021 | |
|---|---|---|---|---|---|
| Cash from operations | 216,812 | 2,403,379 | 5,179,738 | 3,265,668 | 2,532,774 |
| − Capital spending | 188,629 | 171,503 | 99,799 | 57,214 | 65,172 |
| = Free cash flow | 28,183 | 2,231,876 | 5,079,939 | 3,208,454 | 2,467,602 |
| − Stock pay | 163,494 | 176,676 | 160,720 | 184,086 | 134,621 |
| = Real free cash flow | -135,311 | 2,055,200 | 4,919,219 | 3,024,368 | 2,332,981 |
| Real free cash flow, % of revenue | -0.4% | 5.8% | 14.4% | 9.0% | 8.6% |
What this means. Stock pay uses no cash today, but it gives employees part of the company, so this table subtracts its value from free cash flow.
What does an investor pay for Lennar today?
At $84.92 a share on October 23, 2026, Lennar trades at 16.1x trailing earnings. That means investors pay $16.10 for each dollar earned over the last twelve months. A P/E is useful only if profits repeat. Q3 2026 orders fell 9%. The average delivered home sold for $372,000, down from $383,000 a year earlier, while the 30-year mortgage rate was 7.32% on October 22, 2026. Affordability, demand and pricing therefore matter more than the headline multiple.