Lennar earnings date and guidance
MyStockButler's October 2026 analysis: Lennar's next results are expected on December 15, 2026. Watch whether closings release cash after deliveries and margins meet guidance.
What has Lennar guided for the quarter ending November 2026?
Lennar began the quarter ending November 2026 with a backlog of 16,857 homes, fewer than management’s delivery target. Backlog means signed contracts, not completed sales or cash already collected: the buyer usually pays a deposit, Lennar builds the home, and revenue arrives when the buyer closes and receives the title. So Lennar must keep finding buyers while it finishes homes already under construction.
The table sets out the ranges for new orders, deliveries, average selling price, gross margin, SG&A and financial-services operating earnings.
| The period guided | Low | High | The date it was given | |
|---|---|---|---|---|
| New Orders (homes) | Quarter to Nov 2026 | 19,500 | 20,500 | Sep 16, 2026 |
| Deliveries (homes) | Quarter to Nov 2026 | 22,000 | 23,000 | Sep 16, 2026 |
| Average Sales Price (US$ per home) | Quarter to Nov 2026 | 370,000 | 380,000 | Sep 16, 2026 |
| Gross Margin % on Home Sales | Quarter to Nov 2026 | 15.5% | 16.0% | Sep 16, 2026 |
| SG&A as a % of Home Sales | Quarter to Nov 2026 | 8.7% | 9.0% | Sep 16, 2026 |
| Financial Services Operating Earnings (US$ millions) | Quarter to Nov 2026 | 90 | 95 | Sep 16, 2026 |
What this means. The home deliveries count may not match the homes used to calculate reported revenue because it includes homes from partly owned businesses.
Has Lennar kept its past promises?
Management’s record is mixed. Gross margin has been the weak point, with repeated misses, and annual delivery expectations fell in both 2025 and 2026. The government shutdown added a temporary headwind, but continuing affordability pressure, incentives and land costs better explain the broader margin problem.
Lennar also made operating progress. Miller said construction costs per square foot fell 6% from a year earlier, while construction time reached 116 days. The company met its third-quarter delivery forecast, and actual gross margin was 15.8%. PulteGroup, a rival public homebuilder, reported a 24.8% home-sale gross margin in the same quarter.
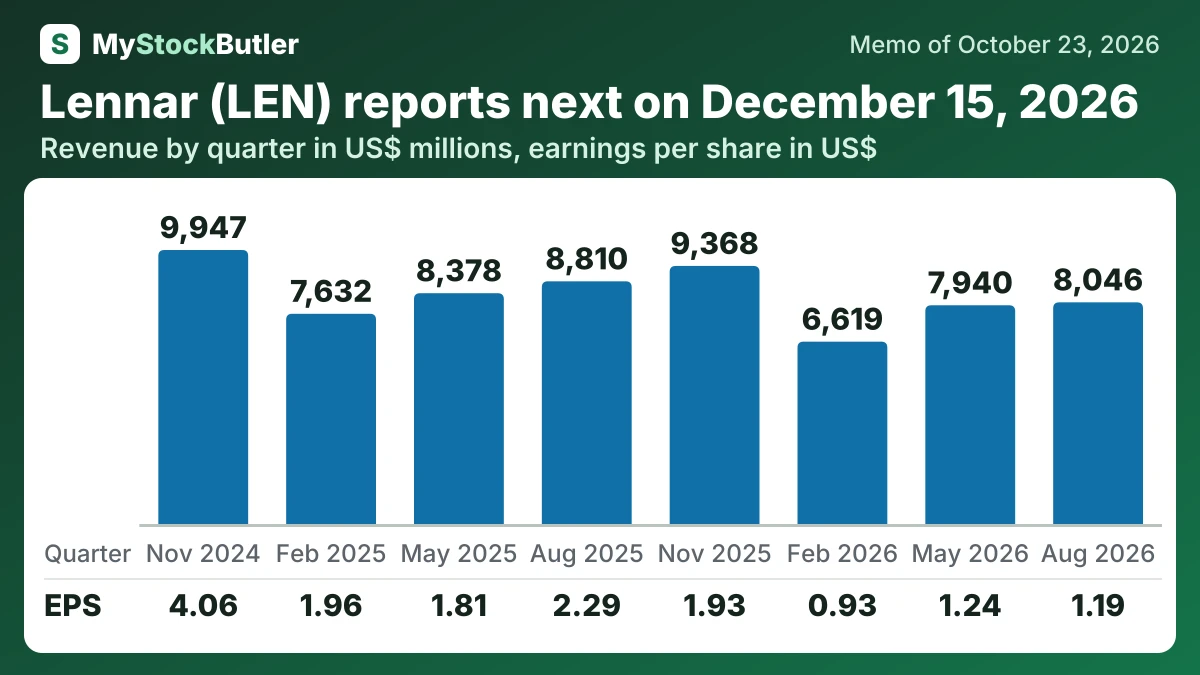
What has Lennar's revenue and profit trend been?
August 2026 showed a modest sequential improvement, not a confirmed recovery.
| Aug 2026 | May 2026 | Feb 2026 | Nov 2025 | Aug 2025 | May 2025 | Feb 2025 | Nov 2024 | |
|---|---|---|---|---|---|---|---|---|
| Revenue | 8,046,119 | 7,939,872 | 6,619,476 | 9,367,609 | 8,810,278 | 8,377,502 | 7,631,545 | 9,946,888 |
| Operating income | 459,814 | 398,296 | 216,201 | 643,925 | 699,614 | 628,446 | 695,839 | 1,363,901 |
| Net income | 283,876 | 304,772 | 229,383 | 490,237 | 590,967 | 477,449 | 519,526 | 1,096,214 |
| EPS, diluted | 1.19 | 1.24 | 0.93 | 1.93 | 2.29 | 1.81 | 1.96 | 4.06 |
What this means. The capital spending row shows changes in net property additions, not the company’s total cash purchases, so a negative number does not necessarily mean the company received cash.