IP earnings: date, guidance and results
MyStockButler's October 2026 analysis: IP's next results are expected on February 4, 2027. The one thing to watch is whether North American price realization and execution continue improving while demand remains modest.
What has IP guided for 2026?
Management guides North American segment operating profit to $460 million–$500 million in the fourth quarter of 2026. Full-year guidance is $1.345 billion–$1.385 billion. Capital spending guidance is $2.0 billion–$2.1 billion. Free-cash-flow guidance is $100 million–$200 million. North American adjusted EBITDA was above guidance twice and below guidance twice.
| Period guided | Low | High | Date given | |
|---|---|---|---|---|
| Packaging Solutions North America Business Segment Operating Profit | Fourth quarter 2026 | 460 | 500 | Oct 28, 2026 |
| Packaging Solutions North America Business Segment Operating Profit | Full-year 2026 | 1,345 | 1,385 | Oct 28, 2026 |
| PS NA Adjusted EBITDA | Fourth quarter 2026 | 700 | 740 | Oct 28, 2026 |
| PS NA Adjusted EBITDA | Full-year 2026 | 2,270 | 2,310 | Oct 28, 2026 |
| Recycling Business EBITDA | Fourth quarter 2026 | 5 | 5 | Oct 28, 2026 |
| Recycling Business EBITDA | Full-year 2026 | 18 | 18 | Oct 28, 2026 |
| Capital expenditures | Full-year 2026 | 2,000 | 2,100 | Aug 5, 2026 |
| Net pension expense (income), U.S. defined benefit plans | Full-year 2026 | -14 | -14 | Feb 27, 2026 |
Has IP kept its past promises?
IP’s record earns three out of five on the comparable promises reviewed. North American adjusted EBITDA was above guidance twice and below it twice; EMEA was above once and below three times. That mixed record makes the new forecast a target to test, not a funding plan.
| What management forecast | Checked | Above | Within | Below |
|---|---|---|---|---|
| Packaging Solutions North America adjusted EBITDA | 4 quarters | 2 | 0 | 2 |
| Packaging Solutions EMEA adjusted EBITDA | 4 quarters | 1 | 0 | 3 |
What has happened to IP's revenue and profit?
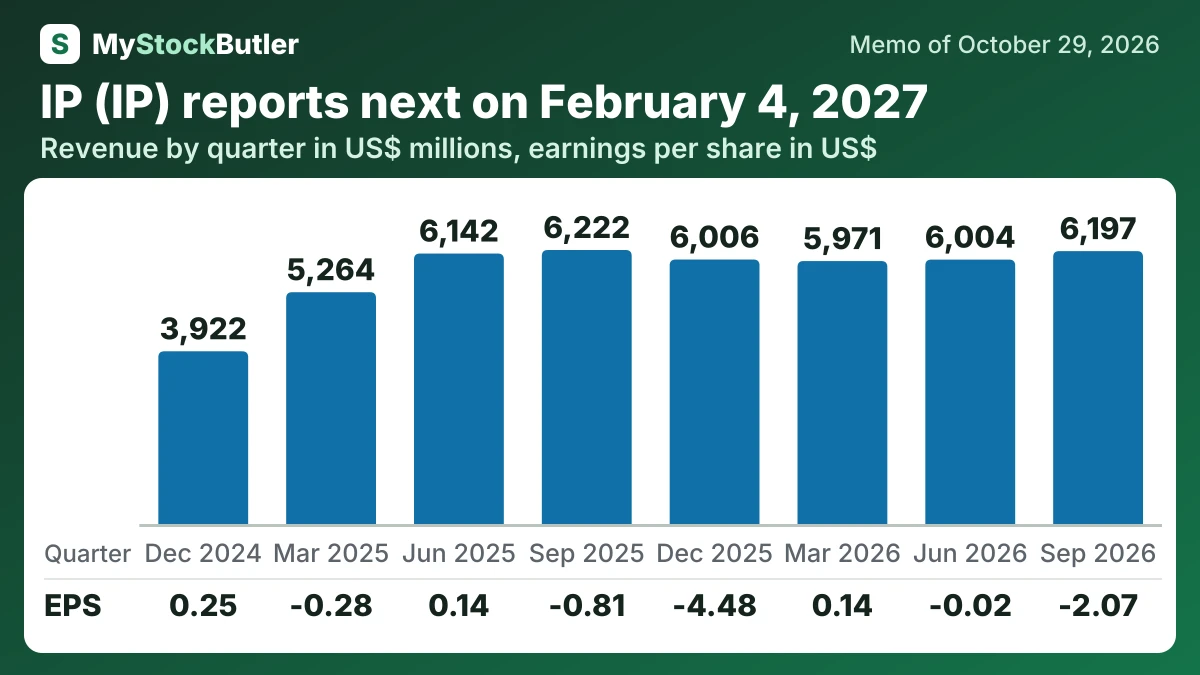
Revenue was $6.2 billion in the quarter, slightly below $6.2 billion in the same quarter of 2025. North American box shipments fell about 2%, but price increases partly offset the weaker volume.
| Sep 2026 | Jun 2026 | Mar 2026 | Dec 2025 | Sep 2025 | Jun 2025 | Mar 2025 | Dec 2024 | |
|---|---|---|---|---|---|---|---|---|
| Revenue | 6,197 | 6,004 | 5,971 | 6,006 | 6,222 | 6,142 | 5,264 | 3,922 |
| Gross margin | 31.2% | 27.6% | 28.9% | 31.4% | 31.1% | 28.0% | 27.7% | 29.5% |
| Operating income | -1,113 | 45 | 151 | -2,565 | -594 | 219 | -68 | 163 |
| Earnings (loss) from continuing operations | -1,097 | -12 | 76 | -2,363 | -426 | 75 | -124 | 88 |
| EPS, diluted | -2.07 | -0.02 | 0.14 | -4.48 | -0.81 | 0.14 | -0.28 | 0.25 |
What this means. Free cash flow includes cash from a business the company has already sold, so it does not line up exactly with the sales and profit shown.
What should people watch in IP's next results?
The next results call, expected at the end of January 2027, should test inventory release, capital spending and North American earnings, and provide 2027 guidance. Investors should compare that guidance with cash after investment and dividends.