Smurfit WestRock stock forecast 2027–2029
MyStockButler's October 2026 analysis: The weighted scenario is $32.56 in October 2029, with a 50% base probability. It hinges on price recovery, steadier box volumes, and cash conversion.
Where could Smurfit WestRock's shares be by 2029?
The weighted path is $14.79 in October 2027. It rises to $23.16 in October 2028 and $32.56 in October 2029, excluding dividends. The final weighted share price is 19% below today’s $40.33; including dividends, the modeled return is -6%.
The range is extreme. The bear case reaches zero by October 2029, while the bull case reaches $91.29. The probabilities are 35% bear, 50% base and 15% bull.
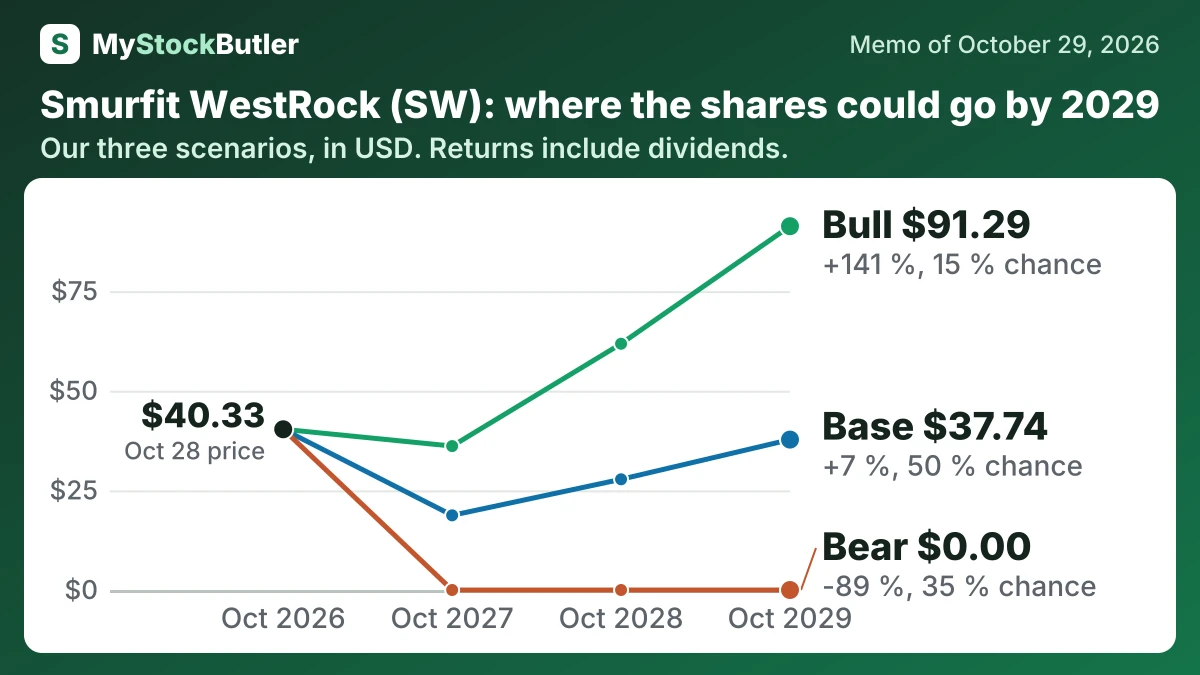
| Case | Probability | October 2027 | October 2028 | October 2029 |
|---|---|---|---|---|
| Bear | 35 % | 0.00 (-96 %) | 0.00 (-92 %) | 0.00 (-89 %) |
| Base | 50 % | 18.74 (-49 %) | 27.78 (-22 %) | 37.74 (+7 %) |
| Bull | 15 % | 36.11 (-6 %) | 61.79 (+62 %) | 91.29 (+141 %) |
| Weighted | 100 % | 14.79 (-59 %) | 23.16 (-34 %) | 32.56 (-6 %) |
What this means. The weighted row is the probability-based average of all three cases, so it can be below the base case even though the base case is most likely.
What has to go right, and what could go wrong for Smurfit WestRock?
Operating profit is the main driver. The base case rises across the forecast as price increases pass through, volumes stabilize and the achieved $400 million synergy run-rate supports margins. The bear case stays near current scale because weak volumes, delayed repricing and roughly $700 million of extra freight and energy costs persist. The bull case reaches above the historical margin anchor as costs ease, utilization improves and closures add leverage.
The bear case assumes soft box demand, freight and energy inflation, slow repricing and weak converting margins. Net debt reaches $16.132 billion by 2029, while the multiple falls to 9.5x. The modeled price is zero in October 2029, after zero in October 2027. Its 35% probability reflects the guidance cut, weak volumes and the limited cash left after capex.
How much cash does Smurfit WestRock really make?
Cash generation is positive after investment, but management’s adjusted free-cash-flow measure gives some costs back. Operating cash flow exceeded capital spending in 2025, whereas the same gap was much smaller in 2024, when the combined business was not yet shown on the same basis.
| 2025 | 2024 | 2023 | 2022 | 2021 | |
|---|---|---|---|---|---|
| Cash from operations | 3,392 | 1,483 | 1,559 | 1,433 | 1,082 |
| − Capital spending | 2,192 | 1,466 | 929 | 930 | 715 |
| = Free cash flow | 1,200 | 17 | 630 | 503 | 367 |
| − Stock pay | 139 | 206 | 66 | 68 | 82 |
| = Real free cash flow | 1,061 | -189 | 564 | 435 | 285 |
| Real free cash flow, % of revenue | 3.4% | -0.9% | 4.7% | 3.2% | 2.4% |
What this means. The company's own free cash flow is higher because it leaves out costs it calls unusual or not ongoing, even though those costs still used money.
What does an investor pay for Smurfit WestRock today?
| Today (Oct 29, 2026) | |
|---|---|
| Share price | 40.33 |
| Market value (calculated) | 21154.14 |
| Enterprise value (calculated) | 34480.14 |
| P/E, last 12 months (calculated) | 45.3x |
| P/E, next 12 months (calculated) | 11.2x |
| Real free cash flow yield (calculated) | 5.0% |
What this means. The next 12 months price-to-earnings figure is much lower because it uses analysts’ expected future profit, not profit already earned.