IP stock forecast 2027–2029
MyStockButler's October 2026 analysis: IP’s weighted price is $31.33 by October 2029, a 4% gain including dividends. It hinges on North American price realization and reliability, Europe’s cash economics and separation terms, and whether savings reach cash earnings.
Where could IP’s shares be by October 2029?
The weighted price is $13.77 by October 2027, a 56% loss including dividends. Bear carries 30% probability. Base carries 50%. Bull carries 20%.
The weighted forecast is below today’s price in the first two years, then nearly recovers it. The weighted price is $13.77 in October 2027, a 56% loss including dividends. It is $22.67 in October 2028, a 25% loss. By October 2029 it reaches $31.33, a 4% gain.
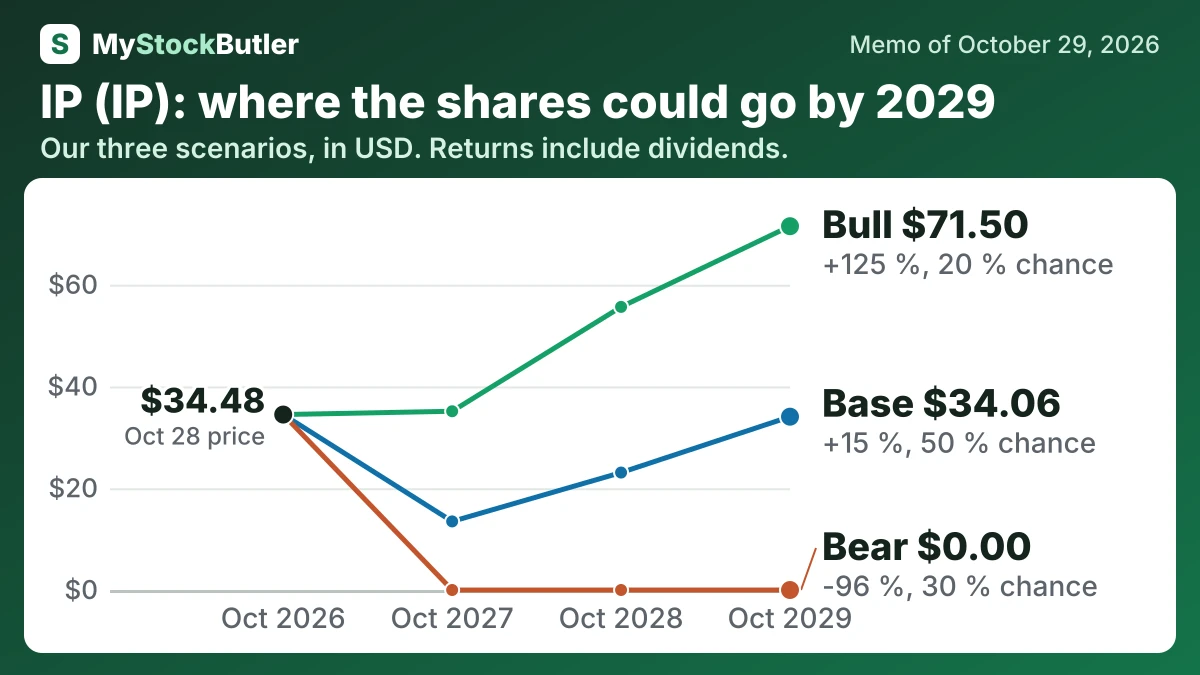
| Case | Probability | October 2027 | October 2028 | October 2029 |
|---|---|---|---|---|
| Bear | 30 % | 0.00 (-97 %) | 0.00 (-96 %) | 0.00 (-96 %) |
| Base | 50 % | 13.48 (-56 %) | 23.08 (-22 %) | 34.06 (+15 %) |
| Bull | 20 % | 35.13 (+7 %) | 55.64 (+73 %) | 71.50 (+125 %) |
| Weighted | 100 % | 13.77 (-56 %) | 22.67 (-25 %) | 31.33 (+4 %) |
What this means. The weighted row is not a promised share price; it is the average value after combining the bear, base, and bull cases by their probabilities.
What has to go right or wrong for IP?
The base case assumes normal operating profit rises from $1.3 billion to $1.6 billion and then $1.9 billion. North American improvement is gradual, EMEA moves from a small loss toward break-even, and corporate costs remain substantial. The anchor is management’s $1.345–$1.385 billion full-year North American target, supported by the latest quarterly improvement. The bear case holds profit at $600 million before a partial recovery to $900 million; weak volumes, input costs and EMEA losses drive that outcome. The bull case reaches $2.4 billion as price increases, reliability and savings become recurring earnings.
The bull case requires stable shipments, successful price pass-through, reliable mills and savings that reach cash earnings. Europe must separate or sell on workable terms. The price reaches $35.13 in the first year and $71.50 by the last date. The probability is 20% because these outcomes are plausible, but sustained free cash flow and reliable EMEA performance are not yet established.
| October 2027 | October 2028 | October 2029 | |
|---|---|---|---|
| Normal operating profit | 1,300 (600 / 1,700) | 1,600 (600 / 2,100) | 1,900 (900 / 2,400) |
| Shares (millions) | 531 (532 / 531) | 533 (534 / 521) | 534 (536 / 505) |
| Dividends per share | 1.85 (0.93 / 1.85) | 1.85 (0.46 / 2.00) | 1.85 (0.00 / 2.20) |
| Enterprise value to normal operating profit | 15.00 (12.00 / 18.00) | 16.00 (10.00 / 20.00) | 17.00 (11.00 / 21.00) |
| Net debt | 12,342 (12,757 / 11,942) | 13,308 (14,102 / 13,033) | 14,106 (15,033 / 14,265) |
How much cash does IP really make?
In 2025, operating activities generated $1.7 billion of cash. Capital spending was $1.9 billion, so free cash flow was negative $159 million.
| 2025 | 2024 | 2023 | 2022 | 2021 | |
|---|---|---|---|---|---|
| Cash from operations | 1,698 | 1,678 | 1,833 | 2,174 | 2,030 |
| Of which, tied up in working capital | 834 | 10 | 2 | 145 | 426 |
| − Capital spending | 1,857 | 921 | 1,141 | 957 | 566 |
| = Free cash flow | -159 | 757 | 692 | 1,217 | 1,464 |
| − Stock pay | 93 | 77 | 53 | ||
| = Real free cash flow | -252 | 680 | 639 |
What this means. The company's own free cash flow is higher in 2021 and 2022 because it subtracts equipment spending after insurance recoveries, while we count the full spending before those recoveries.