IMI dividend history, cash cover and yield
MyStockButler's October 2026 analysis: IMI's forecast dividend rises from £0.38 to £0.41 and then £0.46 per share. In 2025, dividends were £80.6 million against about £250m of stricter real free cash flow, but dividends and buybacks together exceeded free cash flow.
How much does IMI pay per share over time?
Base dividends rise from £0.38 to £0.41 and then £0.46 per share in the table’s units. The path follows a progressive policy and the 10% increase in the 2026 interim dividend. The bear case stays near £0.36 before a modest recovery, while the bull case reaches £0.47 as earnings and cash support continued growth.
| 2025 | 2024 | 2023 | 2022 | 2021 | |
|---|---|---|---|---|---|
| − Paid to minority owners, per share | 0.00 | 0.00 | 0.00 | 0.00 | 0.00 |
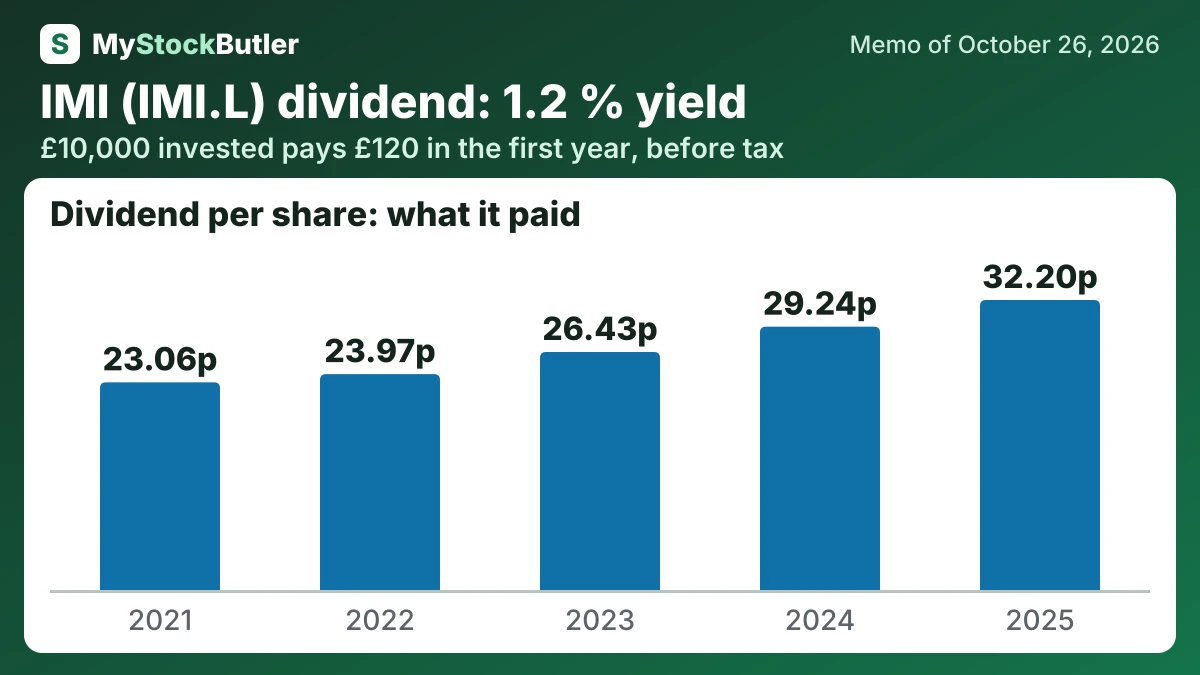
| − Dividends paid, per share | 32.20 | 29.24 | 26.43 | 23.97 | 23.06 |
| − Share buybacks, per share | 80.46 | 38.63 | 0.00 | 0.00 | 74.63 |
How much would IMI's dividend pay you?
£10,000 invested in IMI at its 1.2% dividend yield (our report of October 26, 2026) pays £120.00 in the first year, before tax. If its dividend per share keeps changing 8.7% a year, as it did from 2021 to 2025, and the dividends are reinvested, year 10 pays £296.38, with £1,949.23 received in all.
Before tax. Past dividend growth is not a promise. Information only, not investment advice.
Is IMI's dividend covered by its cash?
A stricter calculation starts with 2025 operating cash of £415.3m. After capital spending of £98.6m, lease payments and interest, free cash flow was about £261m. Treating share-based pay as an economic cost reduces it to about £250m. IMI’s own measure was £289.9m because it includes specified cash-flow classifications and disposal proceeds.
By 2025, IMI had stopped acquiring businesses but increased distributions. Dividends of £80.6 million and buybacks of £201.4 million exceeded free cash flow of £260.8 million. Disposal receipts of £32.7 million helped bridge the gap, although some came from property sales rather than operating-business disposals. IMI’s own net-debt measure ended at £532.8 million, including lease liabilities, while the cash bridge showed £450.7 million.
| 2025 | 2024 | 2023 | 2022 | 2021 | |
|---|---|---|---|---|---|
| Free cash flow | 260.8 | 227 | 223.5 | 156.3 | 167.2 |
| − Dividends paid | 80.6 | 76.0 | 68.8 | 62.2 | 61.8 |
| − Share buybacks | 201.4 | 100.4 | 0 | 0 | 200.0 |
| = Free cash flow not paid out | 50.6 | 154.7 | 94.1 | ||
| = Paid out more than the free cash flow | 21.2 | 94.6 | |||
| Paid out, % of real free cash flow | 112.8% | 81.6% | 32.7% | 43.0% | 168.7% |
What could change IMI's dividend?
The bear case requires delayed Middle East shipments, weaker industrial or vehicle demand and lower-margin project work. Cybersecurity and capacity spending hold back margins, while debt and investment needs slow buybacks. The multiple then contracts as investors lose confidence in cash conversion.
| October 2027 | October 2028 | October 2029 | |
|---|---|---|---|
| Earnings | 360 (328 / 382) | 390 (330 / 432) | 422 (334 / 482) |
| Shares (millions) | 230 (234 / 230) | 228 (232 / 225) | 224 (232 / 220) |
| Dividends per share | 0.38 (0.36 / 0.39) | 0.41 (0.36 / 0.42) | 0.46 (0.38 / 0.47) |
| Price to earnings | 20.00 (17.00 / 22.00) | 20.00 (16.00 / 23.00) | 20.00 (15.00 / 24.00) |