IMI stock forecast 2027–2029
MyStockButler's October 2026 analysis: IMI's weighted scenario reaches 3657.99p by October 2029. It hinges on earnings growth, margin improvement and cash supporting buybacks without weakening the balance sheet.
Where could IMI's shares be by October 2029?
The weighted price reaches 3047.38p in October 2027, excluding dividends. It reaches 3336.66p in October 2028. By October 2029, it reaches 3657.99p, representing a 35% total return.
The bear case has a 25% probability, while the base case has a 55% probability. The bull case has a 20% probability. At the final date, the bear outcome is 2164.15p and the bull outcome is 5246.26p, compared with today’s 2796.00p.
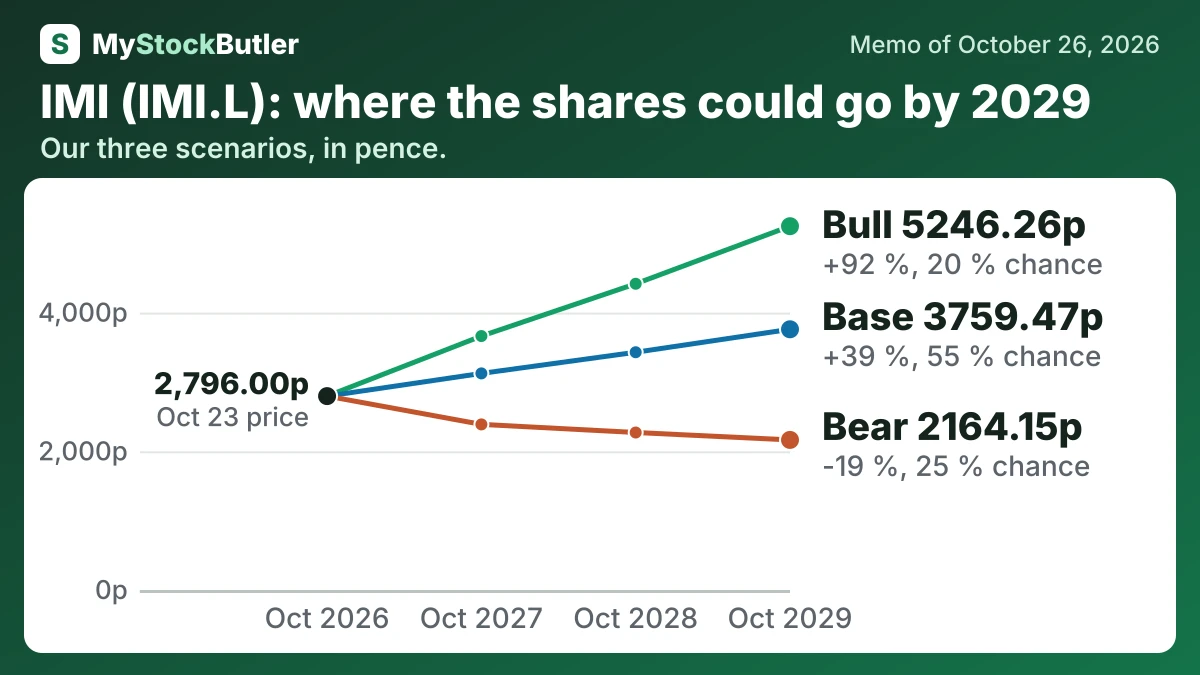
IMI share price scenarios for October 2029: bear 2164.15p, base 3759.47p, bull 5246.26p
| October 2027 | October 2028 | October 2029 | |
|---|---|---|---|
| Earnings | 360 (328 / 382) | 390 (330 / 432) | 422 (334 / 482) |
| Shares (millions) | 230 (234 / 230) | 228 (232 / 225) | 224 (232 / 220) |
| Dividends per share | 0.38 (0.36 / 0.39) | 0.41 (0.36 / 0.42) | 0.46 (0.38 / 0.47) |
| Price to earnings | 20.00 (17.00 / 22.00) | 20.00 (16.00 / 23.00) | 20.00 (15.00 / 24.00) |
What has to go right for IMI, and what could go wrong?
Base earnings are £360m in the first window and £390m in the second. They reach £422m in the third, reflecting FY2027 growth followed by roughly 8% annual growth. The bear row falls to £328m initially, then remains near £330m before recovering slightly. The bull row begins at £382m, reaches £432m, and ends at £482m. The bear case reflects shipment delays, weaker demand and cost pressure; the bull case requires profitable data-centre, energy and automation conversion.
How much cash does IMI really make?
A stricter calculation starts with 2025 operating cash of £415.3m. After capital spending of £98.6m, lease payments and interest, free cash flow was about £261m. Treating share-based pay as an economic cost reduces it to about £250m. IMI’s own measure was £289.9m because it includes specified cash-flow classifications and disposal proceeds.
| 2025 | 2024 | 2023 | 2022 | 2021 | |
|---|---|---|---|---|---|
| Cash from operations | 415.3 | 371.6 | 363.2 | 283.7 | 269.2 |
| − Capital spending | 98.6 | 91.5 | 79.9 | 71.3 | 57.5 |
| − Interest paid | 28.1 | 24.5 | 30.8 | 23.8 | 14.5 |
| = Free cash flow | 260.8 | 227 | 223.5 | 156.3 | 167.2 |
| − Stock pay | 10.9 | 10.8 | 12.9 | 11.7 | 12.0 |
| = Real free cash flow | 249.9 | 216.2 | 210.6 | 144.6 | 155.2 |
What does an investor pay for IMI today?
The dividend offers limited immediate income, while acquisitions and buybacks compete for the cash that could fund it. The table sets out the share price, market value, enterprise value, valuation multiples, free-cash-flow yields and dividend yield.
| Today (Oct 26, 2026) | |
|---|---|
| Share price | 2,796.00 |
| P/E, last 12 months (calculated) | 20.6x |
| P/E, next 12 months (calculated) | 19.8x |
| Free cash flow yield (calculated) | 3.9% |
| Real free cash flow yield (calculated) | 3.8% |
| Dividend yield (calculated) | 1.2% |
What this means. The next twelve months price-to-earnings number uses analysts’ expected profit, so it is a forecast rather than a result the company has already achieved.