FOX earnings date and guidance
MyStockButler's October 2026 analysis: FOX's next results are expected on November 2, 2026. Watch whether ordinary advertising and distribution can grow beyond temporary event effects.
What has FOX guided for fiscal 2027?
FOX has no formal company-wide earnings forecast cadence. For fiscal 2027, guidance calls for $1,000–$1,500 million of buybacks and $245 million of dividends. For Roku, management expects $400 million of annual cost savings and free-cash-flow accretion within two years of closing.
| Period guided | Low | High | Date given | |
|---|---|---|---|---|
| buyback level | Year to Jun 2027 | 1,000 | 1,500 | Sep 9, 2026 |
| total aggregate cash dividends expected to be paid to stockholders | Year to Jun 2027 | 245 | 245 | Aug 6, 2026 |
What this means. The dividend estimate is shown as the same low and high amount, so the company expects about 245 million United States dollars rather than giving a range.
Has FOX kept its past promises?
FOX has returned capital and reduced its share count, but its new performance-pay design and Roku promises still need testing.
Stock compensation costs shareholders because it can create more claims on future profits. FOX recorded US$132 million of stock pay in fiscal 2026, equal to 9.0% of free cash flow. Buybacks work in the opposite direction: FOX spent US$2,000 million repurchasing shares, and average diluted shares fell from 461 million in fiscal 2025 to 439 million in fiscal 2026. The reduction helps each remaining share compete for future earnings, although it does not prove FOX bought at attractive prices.
What is FOX's revenue and profit trend?
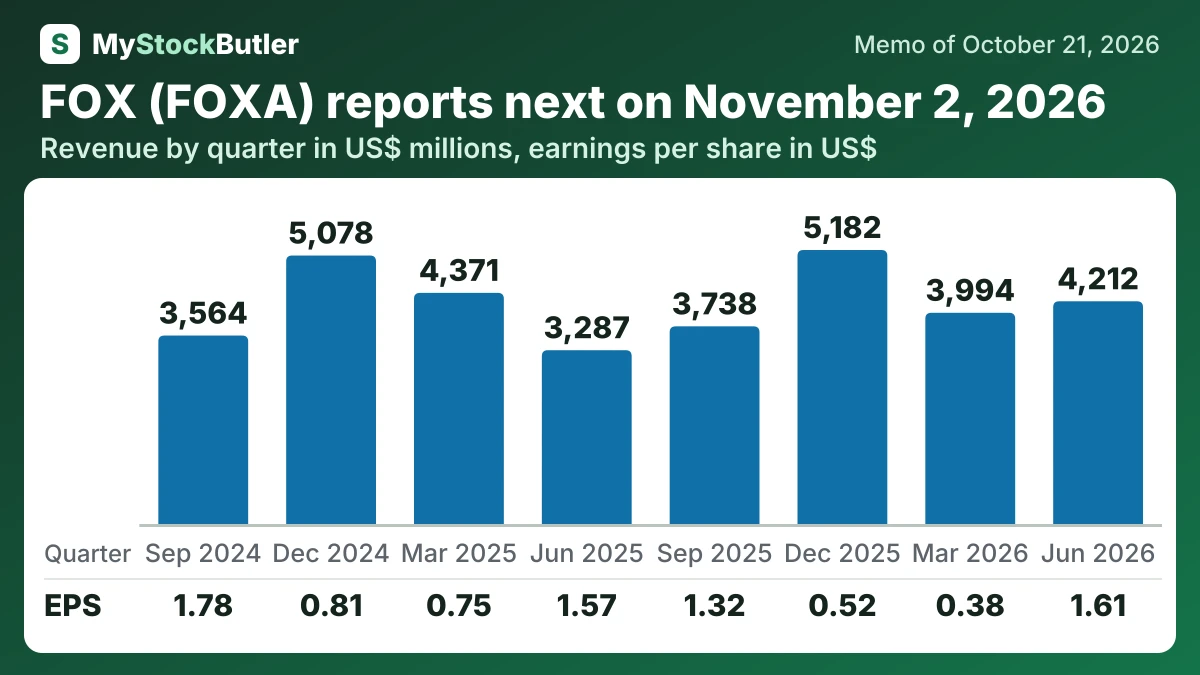
Quarterly revenue rose from $3,287 million to $4,212 million. Operating income rose from $737 million to $971 million. The World Cup and digital advertising drove much of the improvement, but expensive programming pushed gross margin down from 46.5% to 43.5%.
Shareholder net income slipped from $717 million to $691 million, while diluted EPS rose from $1.57 to $1.61 because fewer shares remained. This shows how revenue, operating profit, shareholder earnings and EPS can move differently.
| Jun 2026 | Mar 2026 | Dec 2025 | Sep 2025 | Jun 2025 | Mar 2025 | Dec 2024 | Sep 2024 | |
|---|---|---|---|---|---|---|---|---|
| Revenue | 4,212 | 3,994 | 5,182 | 3,738 | 3,287 | 4,371 | 5,078 | 3,564 |
| Gross margin | 43.5% | 37.6% | 24.8% | 44.2% | 46.5% | 32.2% | 25.6% | 43.4% |
| Operating income | 971 | 821 | 578 | 975 | 737 | 705 | 510 | 927 |
| Net income | 691 | 166 | 229 | 599 | 717 | 346 | 373 | 827 |
| EPS, diluted | 1.61 | 0.38 | 0.52 | 1.32 | 1.57 | 0.75 | 0.81 | 1.78 |
| = Free cash flow | 726 | 1,767 | -791 | -234 | 1,394 | 1,941 | -436 | 94 |