Fiserv earnings date and guidance
MyStockButler's October 2026 analysis: Fiserv's next results are expected on November 3, 2026. For Fiserv, the key watch is whether completed implementations and improving client activity support the Q4 recovery.
What has Fiserv guided for 2026?
Management’s 2026 guidance calls for organic revenue of -1.0% to 0.0%, adjusted operating margin of 31.0% to 31.5% and adjusted EPS of $7.20 to $7.40. Its longer-term target is average adjusted revenue growth of 4%–6% from 2026 through 2029, adjusted operating margin above 37% in 2029 and adjusted EPS above $12 that year.
| Period guided | Low | High | Date given | |
|---|---|---|---|---|
| Organic Revenue Growth | Year to Dec 2026 | -1.0% | 0.0% | Aug 6, 2026 |
| Adjusted Revenue Growth | Year to Dec 2026 | -1.5% | -0.5% | Aug 6, 2026 |
| Adjusted Operating Margin | Year to Dec 2026 | 31.0% | 31.5% | Aug 6, 2026 |
| Adjusted EPS | Year to Dec 2026 | 7.20 | 7.40 | Aug 6, 2026 |
| FCF Conversion (% of adjusted net income) | Year to Dec 2026 | 90.0% | 90.0% | Aug 6, 2026 |
| Adjusted Effective Tax Rate | Year to Dec 2026 | 19.0% | 19.0% | Aug 6, 2026 |
Has Fiserv kept its past promises?
Fiserv first cut its annual organic-growth outlook in October 2025 from about 10% to 3.5%–4%; actual growth was 3.8%. Adjusted earnings per share reached $8.64, above the reset range of $8.50–$8.60. Meeting a revised forecast was progress, but repeated resets remain a warning as the company turns to execution.
| What management forecast | Checked | Above | Within | Below |
|---|---|---|---|---|
| Organic revenue growth (formerly internal revenue growth) | 5 years | 3 | 1 | 1 |
| Adjusted earnings per share | 5 years | 2 | 2 | 1 |
| Adjusted Operating Margin Expansion | 5 years | 2 | 0 | 3 |
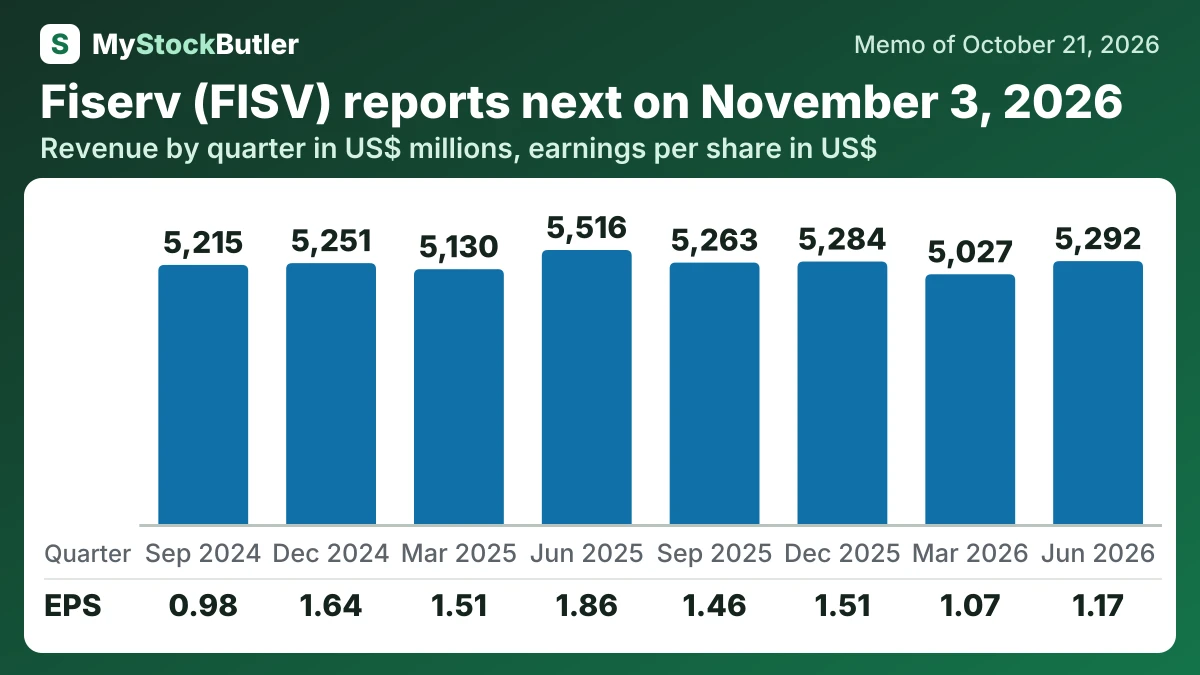
How have Fiserv revenue and profit changed over the last eight quarters?
Its recent record contains many beats. Across eight reported quarters from Q3 2024 through Q2 2026, Fiserv beat estimates six times and missed twice. But the misses came during the periods linked to the major resets. A future beat could simply mean that analysts have lowered the bar. The better test is whether revenue, activity, margins and estimates improve together.
| Jun 2026 | Mar 2026 | Dec 2025 | Sep 2025 | Jun 2025 | Mar 2025 | Dec 2024 | Sep 2024 | |
|---|---|---|---|---|---|---|---|---|
| Revenue | 5,292 | 5,027 | 5,284 | 5,263 | 5,516 | 5,130 | 5,251 | 5,215 |
| Gross margin | 54.7% | 54.1% | 57.1% | 58.9% | 61.8% | 59.6% | 61.6% | 61.5% |
| Operating income | 1,015 | 918 | 1,291 | 1,436 | 1,696 | 1,395 | 1,668 | 1,602 |
| Net income | 627 | 571 | 811 | 792 | 1,026 | 851 | 938 | 564 |
| EPS, diluted | 1.17 | 1.07 | 1.51 | 1.46 | 1.86 | 1.51 | 1.64 | 0.98 |
What this means. Free cash flow is lower than cash from operations because it also subtracts money spent on software and other intangible assets, not just equipment and buildings.
What should people watch in Fiserv's next results?
Fiserv schedules its Q3 earnings call for November 3, 2026. A revenue decline would not contradict guidance by itself, because management already expects one. The useful questions are whether the decline is narrowing and whether Fiserv can support its Q4 acceleration with evidence from implementations and client activity.
Investors should also connect the technology bill with service reliability, delivery speed and client retention. Rising spending alongside more delays would imply that the reset needs more time or money. Improving systems and delayed contracts beginning to produce revenue would make the spending look productive.