Global Payments stock forecast 2027–2029
MyStockButler's October 2026 analysis: The weighted forecast for Global Payments reaches $102.57 by October 2027 and $175.75 by October 2029. It hinges on profitable Worldpay integration, cash conversion and deleveraging.
Where could Global Payments shares be by October 2029?
The range reflects substantial execution risk. By October 2029, the bear case reaches $63.98 while the bull case reaches $321.43, against today’s $85.88. The probabilities are 30% bear, 50% base and 20% bull.
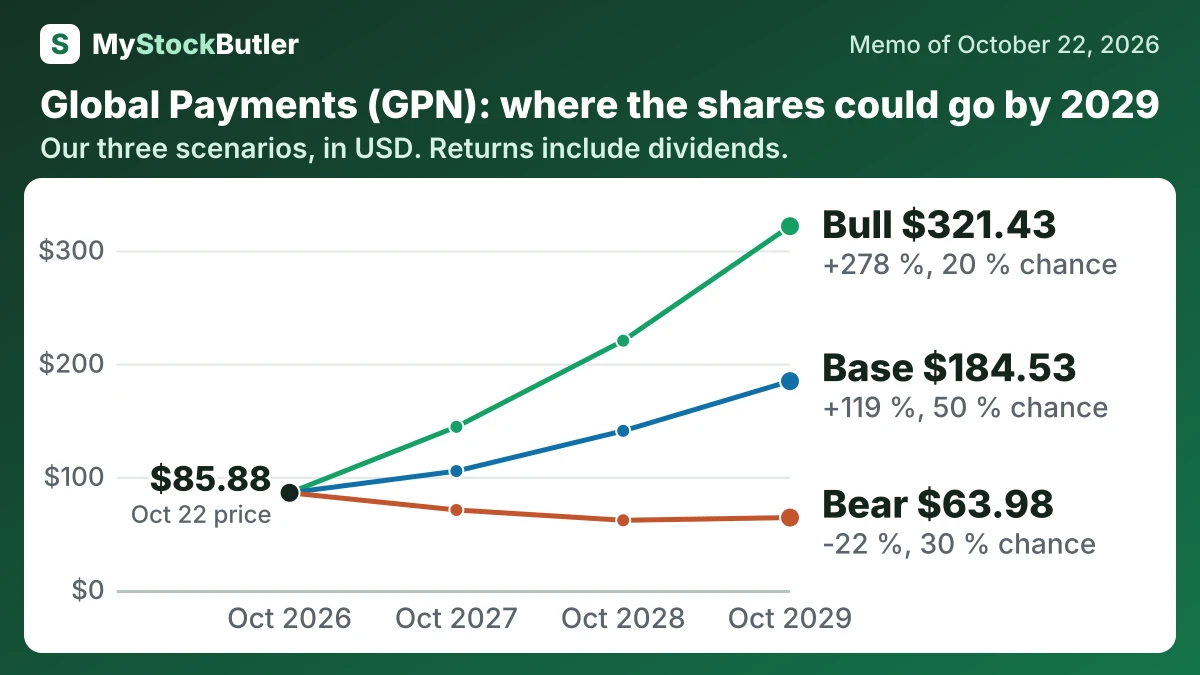
| Case | Probability | October 2027 | October 2028 | October 2029 |
|---|---|---|---|---|
| Bear | 30 % | 70.68 (-17 %) | 61.60 (-26 %) | 63.98 (-22 %) |
| Base | 50 % | 105.07 (+24 %) | 140.60 (+66 %) | 184.53 (+119 %) |
| Bull | 20 % | 144.14 (+69 %) | 220.26 (+159 %) | 321.43 (+278 %) |
| Weighted | 100 % | 102.57 (+21 %) | 132.83 (+57 %) | 175.75 (+108 %) |
What has to go right, and what could go wrong for Global Payments?
The bear case assumes travel weakness persists, Worldpay produces higher losses or churn, savings arrive late and cash remains constrained. Earnings fall, buybacks stay modest and investors retain a low multiple. The shares reach $70.68 in October 2027 and $63.98 in October 2029. The 30% probability reflects the guidance reduction, high debt and first-half operating cash flow below capital spending.
The bull case assumes Genius and Payrix convert into active retained merchants, Worldpay cross-selling adds profitable revenue, integration savings arrive without disruption and debt falls quickly. Earnings growth, buybacks and a rerating lift the shares to $144.14 initially and $321.43 by October 2029. The 20% probability reflects the need for software adoption, retention, savings and cash conversion to succeed together.
How much cash does Global Payments really make?
In the first half of 2026, operating cash flow was US$373,798 thousand. Capital expenditures were US$497,000 thousand, leaving negative US$123,202 thousand before further adjustments. Management’s Q2 adjusted free cash flow was US$687 million, or about 75% of adjusted net income, but that answers a different question from the statutory cash-flow statement.
| 2025 | 2024 | |
|---|---|---|
| − Capital spending | 1,052,776 | 953,147 |
| − Stock pay | 253,205 | 181,169 |
What this means. Stock pay is deducted even though no cash was paid because giving employees shares reduces existing investors’ ownership.
What does an investor pay today for Global Payments?
A forward P/E compares today’s share price with forecast earnings per share over the next twelve months. It is not a five-year payback promise. Acquired customer relationships and technology are recorded as intangible assets, then amortized, which lowers accounting profit without another cash payment in that quarter. During the second quarter of 2026, GPN added back $757.6 million of acquired-intangible amortization; GAAP diluted EPS was $0.05, while adjusted EPS was $3.46. The forward ratio therefore needs a clear earnings definition: its implied EPS is roughly $16.20, above management’s August guidance of $13.60–$13.80 for calendar 2026.
| Today (Oct 22, 2026) | |
|---|---|
| Share price | 85.88 |
| Market value (calculated) | 22,725,427.333 |
| Enterprise value (calculated) | 40,871,555.333 |
| P/E, next 12 months (calculated) | 5.3x |
| EV / revenue, last 12 months (calculated) | 3.2x |
| Price to book (calculated) | 1.0x |
| Dividend yield (calculated) | 1.2% |
What this means. The enterprise value is much higher than the market value because it includes debt and subtracts cash, showing the cost of buying the whole business, not just its shares.