Eversource Energy earnings date and guidance
MyStockButler's October 2026 analysis: Eversource Energy's next results are expected on November 4, 2026. For Eversource Energy, watch the effect of lower transmission returns on future earnings.
What has Eversource Energy guided for 2026?
Management guides to $4.57–$4.72 of recurring EPS in 2026 and targets 5%–7% cumulative EPS growth for 2026–2030. It plans $26.5 billion of infrastructure investment and $800 million–$1.1 billion of common equity issuance. The weighted case prices at the first and last forecast dates, the return, and bear/base/bull probabilities are not stated.
| The period guided | Low | High | The date it was given | |
|---|---|---|---|---|
| 2026 non-GAAP recurring earnings per share | Year to Dec 2026 | 4.57 | 4.72 | Jul 30, 2026 |
| Cumulative long-term earnings per share growth rate | 2026–2030 | 5.0% | 7.0% | Jul 30, 2026 |
| Total, projected capital expenditures, 2026 | Year to Dec 2026 | 5,072 | 5,072 | Feb 17, 2026 |
| Total, projected capital expenditures, 2027 | Year to Dec 2027 | 5,175 | 5,175 | Feb 17, 2026 |
| Equity to be raised, excluding annual dividend reinvestment and equity compensation issuances | 2026–2030 | 800 | 1,100 | Feb 12, 2026 |
What this means. The projected capital spending totals include some items that do not involve paying cash during the year.
Did Eversource Energy keep its past promises?
Management’s record is mixed. It generally kept its earnings promises, but transmission and distribution spending repeatedly exceeded early plans. Spending more can expand the future rate base, but it first creates a financing need. Retirement-plan benefit income is also accounting income, not cash collected from customers.
| What management forecast | Checked | Above | Within | Below |
|---|---|---|---|---|
| Non-GAAP earnings per share | 5 years | 0 | 4 | 1 |
| Projected Transmission Capital Expenditures | 4 years | 4 | 0 | 0 |
| Projected Capital Expenditures For Core Businesses: Electric Distribution | 4 years | 4 | 0 | 0 |
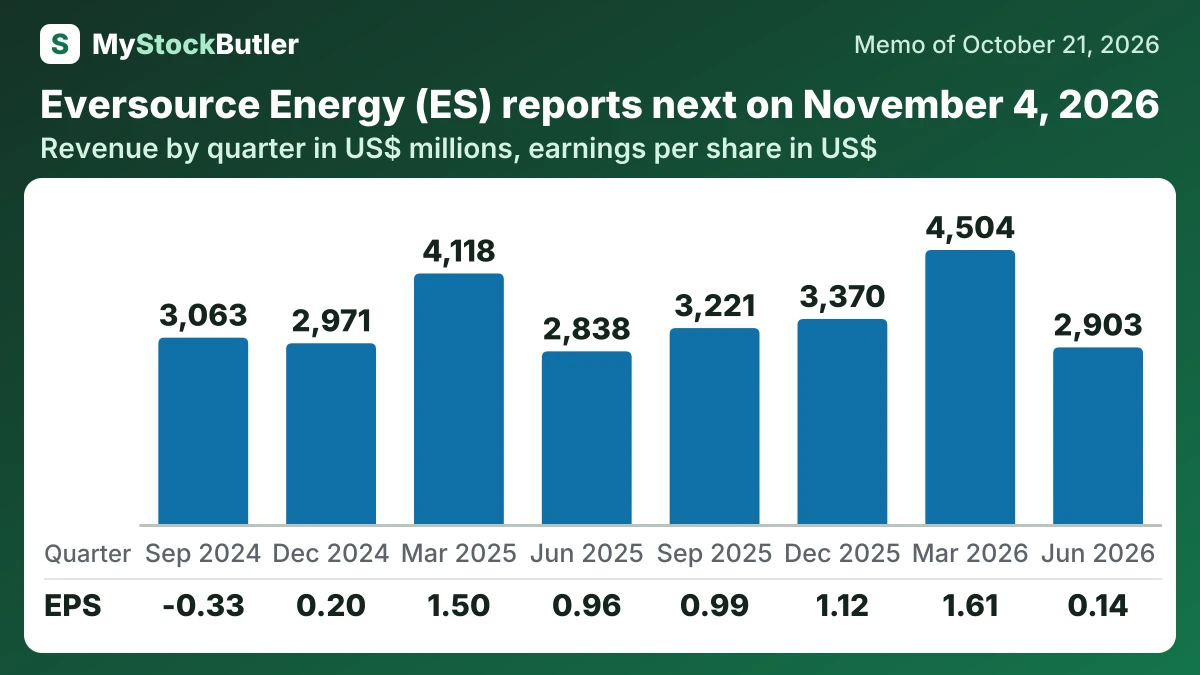
What were Eversource Energy's last eight quarters?
The same quarter of the prior year is the useful comparison because gas earnings are seasonal. Revenue and operating income moved in opposite directions, while net income and diluted earnings per share fell sharply.
| Jun 2026 | Mar 2026 | Dec 2025 | Sep 2025 | Jun 2025 | Mar 2025 | Dec 2024 | Sep 2024 | |
|---|---|---|---|---|---|---|---|---|
| Revenue | 2,903,189 | 4,504,363 | 3,370,196 | 3,220,625 | 2,838,068 | 4,118,355 | 2,971,488 | 3,063,224 |
| Operating income | 540,874 | 1,076,148 | 710,464 | 688,682 | 663,049 | 926,394 | 347,839 | 612,400 |
| Net income | 53,680 | 606,841 | 421,306 | 367,549 | 352,728 | 550,788 | 72,520 | -118,057 |
| EPS, diluted | 0.14 | 1.61 | 1.12 | 0.99 | 0.96 | 1.50 | 0.20 | -0.33 |
| Cash from operations | 1,090,457 | 1,324,326 | 916,057 | 1,099,611 | 1,057,309 | 1,040,595 | 642,131 | 555,580 |
| = Free cash flow | 76,296 | 315,015 | -67,254 | -26,346 | 15,292 | 33,211 | -546,548 | -515,353 |
What this means. The company can show a profit but have little or negative free cash flow because it spends nearly all the cash from its daily business on equipment and buildings.
What should I watch in Eversource Energy's next results?
Regulation can reduce future earnings and require repayment of past collections. The Federal Energy Regulatory Commission, the federal transmission regulator, cut Eversource’s allowed base return to about 9.6%. A lower return reduces what the company can earn on transmission assets going forward.
A separate refund dispute concerns earlier collections. As of June 30, the estimated pretax refund ranged from $62.0 million to $968.4 million. That is a different risk from the lower ongoing return: one affects future earnings, while the other reverses past cash or creates a liability.