E.ON earnings date and guidance
MyStockButler's November 2026 analysis: E.ON's next results are expected on November 11, 2026. E.ON's next release should show whether delayed network projects caught up and how borrowing and interest developed.
What has E.ON guided for 2026?
Management guides to adjusted EBITDA of €9.4 billion to €9.6 billion and adjusted net income of €2.7 billion to €2.9 billion for 2026. EBITDA measures operating earnings before interest, tax and depreciation; net income is closer to what belongs to shareholders.
| Period | Low | High | Given on | |
|---|---|---|---|---|
| Adjusted EBITDA (EUR billions) | 2026 | 9.4 | 9.6 | August 12, 2026 |
| Adjusted net income (EUR billions) | 2026 | 2.7 | 2.9 | August 12, 2026 |
| Adjusted net income per share (EUR) | 2026 | 1.03 | 1.11 | August 12, 2026 |
| Investments (EUR billions) | 2026 | 8.7 | 8.7 | August 12, 2026 |
| Dividend growth (%) | 2026 | 5.0% | February 25, 2026 |
What this means. The earnings forecasts leave out temporary regulatory accounting effects that do not change the company's value, so they may differ from the earnings shown in its financial statements.
Has E.ON kept its past promises?
E.ON also passed one forecasting test. In its 2024 annual report, it forecast 2025 adjusted EBITDA, operating earnings before interest, tax, depreciation and amortisation after selected adjustments, at €9.6–€9.8 billion. It later reported approximately €9.8 billion. That supports confidence in its forecasting, but durable shareholder value still depends on cash generation and returns from its investments.
| What management forecast | Checked | Above | Within | Below |
|---|---|---|---|---|
| Adjusted EBITDA | 4 years | 4 | 0 | 0 |
| Adjusted net income | 5 years | 3 | 2 | 0 |
| Earnings per share from adjusted net income | 5 years | 3 | 2 | 0 |
What this means. The company beat its forecast for adjusted earnings before interest, taxes, depreciation, and amortization in all four years shown.
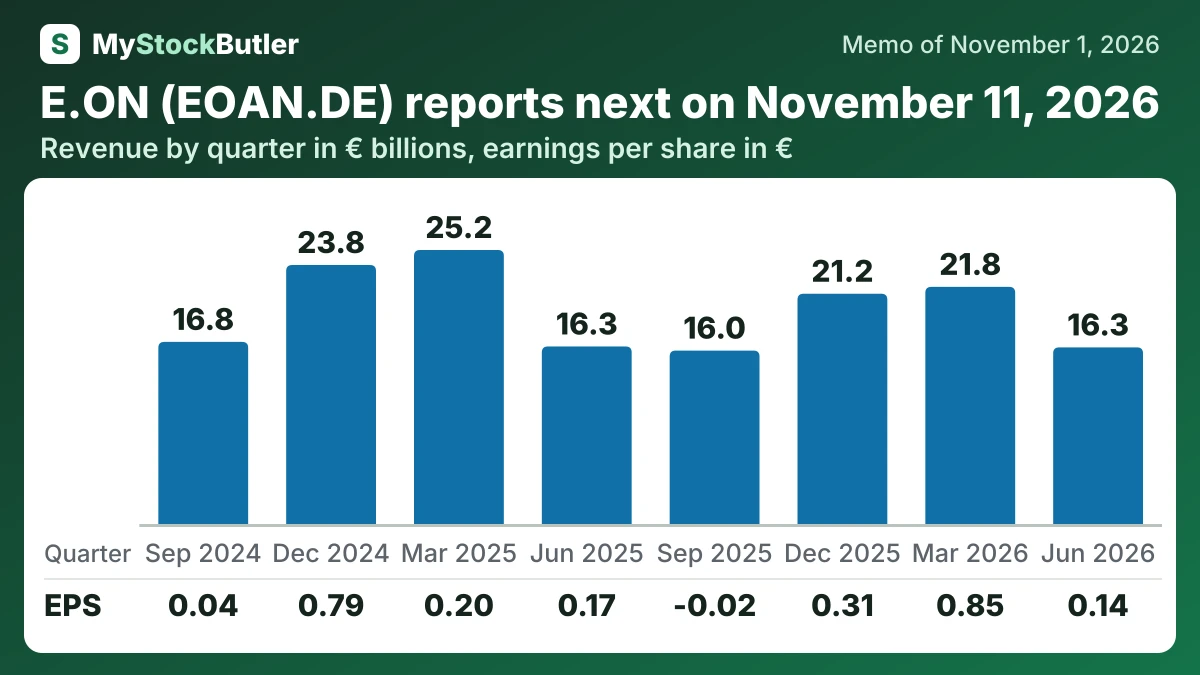
What is E.ON's revenue and profit trend?
The adjusted picture was steadier. Adjusted EBITDA was €2.15 billion in the quarter, almost unchanged from a year earlier. Adjusted net income rose from €571 million to €582 million. The quarter still contained a negative derivative effect of €336 million, while the first half recorded a positive effect of €1.21 billion. Accounting direction can change quickly.
| Jun 2026 | Mar 2026 | Dec 2025 | Sep 2025 | Jun 2025 | Mar 2025 | Dec 2024 | Sep 2024 | |
|---|---|---|---|---|---|---|---|---|
| Revenue | 16,253 | 21,823 | 21,190 | 15,960 | 16,338 | 25,216 | 23,835 | 16,759 |
| Gross margin | 24.6% | 23.6% | 25.2% | 27.1% | 30.1% | 20.4% | 19.0% | 24.2% |
| Operating margin | 5.2% | 17.9% | 6.7% | 2.5% | 6.7% | 4.5% | 13.2% | 3.8% |
| EPS, diluted | 0.14 | 0.85 | 0.31 | -0.02 | 0.17 | 0.20 | 0.79 | 0.04 |
What this means. Gross margin is our estimate, calculated from sales minus materials costs, because the company does not publish gross profit.
What should I watch in E.ON's next results?
E.ON is scheduled to report January–September results on November 11, 2026, followed by its annual report on February 24, 2027. The first update should show whether delayed network projects caught up and how borrowing and interest developed before the heavy final-quarter spending season.
Regulation is equally important. Germany’s regulator expected to finalize its gas-network cost-of-capital decision by the end of 2026 and electricity-network rates separately in 2027. An August gas draft proposed a 3.76% weighted average cost of capital. That is an allowance for assumed debt and equity costs, not the eventual electricity decision, but a low allowance could squeeze returns.