E.ON dividend: payment and cash coverage
MyStockButler's November 2026 analysis: E.ON’s forecast dividend per share rises from €0.60 to €0.64. Recent free cash flow was negative €1.36 billion, so investment and dividends competed for funding.
How much does E.ON pay per share?
Dividends rise gradually in the base case, from €0.60 to €0.64, below the policy ceiling of 5% annual growth. The bear case holds the payment at €0.57 because negative free cash flow and rising debt constrain cash. The bull case reaches €0.66 by applying the full 5% rate, which requires better network cash generation.
| 2025 | 2024 | 2023 | 2022 | 2021 | |
|---|---|---|---|---|---|
| Net income | 1,734 | 4,531 | 456 | 1,831 | 4,691 |
| EPS, diluted | 0.66 | 1.73 | 0.18 | 0.70 | 1.80 |
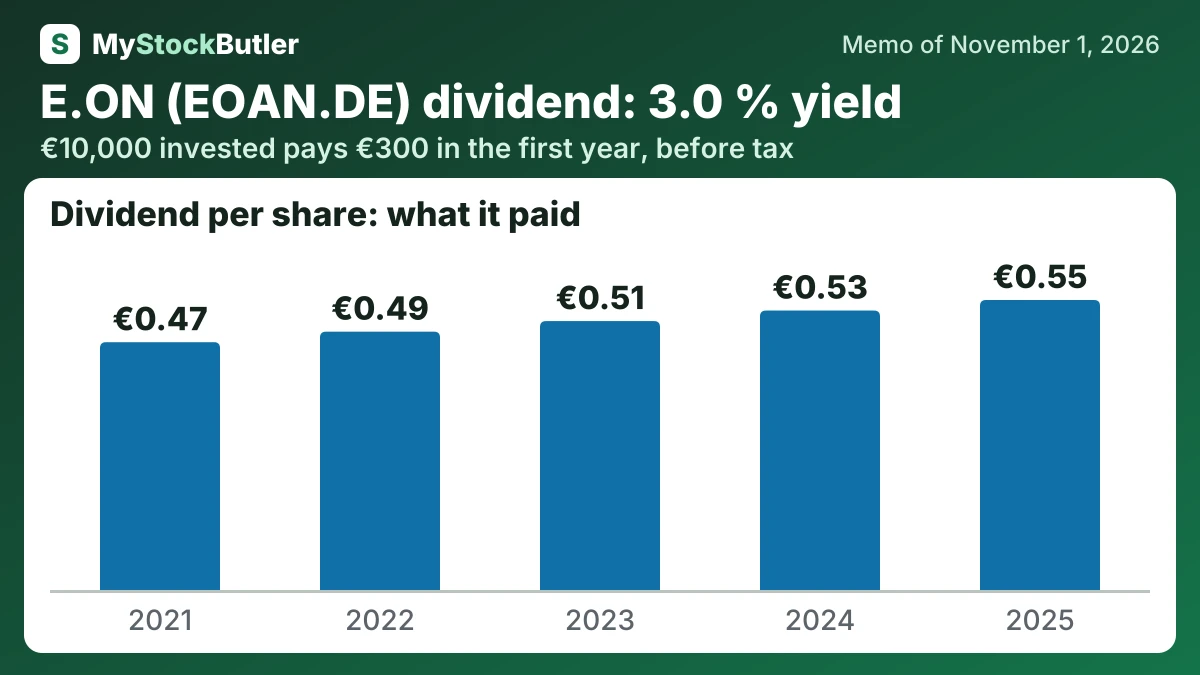
| Dividend per share | 0.57 | 0.55 | 0.53 | 0.51 | 0.49 |
What this means. The gross profit and gross margin are our estimates because E.ON does not publish gross profit, and we subtract only materials costs from sales.
How much would E.ON's dividend pay you?
€10,000 invested in E.ON at its 3.0% dividend yield (our report of November 1, 2026) pays €300.00 in the first year, before tax. If its dividend per share keeps changing 4.0% a year, as it did from 2021 to 2025, and the dividends are reinvested, year 10 pays €583.77, with €4,246.10 received in all.
Before tax. Past dividend growth is not a promise. Information only, not investment advice.
Is E.ON’s dividend covered by its cash?
Free cash flow asks how much cash remains after investment under a particular company measure. E.ON recorded negative free cash flow in four of the five years from 2021 through 2025, yet continued paying dividends to shareholders and minority owners. That does not mean E.ON made an accounting loss: a company can use cash balances, borrow, or sell assets to fund distributions. It does mean investment and dividends competed for funding.
E.ON produces substantial operating cash, but its investment program currently consumes more. Operating cash flow was €7 billion in 2025, against €7.94 billion of capital spending. After €421 million of lease payments, free cash flow was negative €1.36 billion; after stock pay of €140.1 million, “real” free cash flow was about negative €1.5 billion.
| 2025 | 2024 | 2023 | 2022 | 2021 | |
|---|---|---|---|---|---|
| Free cash flow | -1,358 | -1,675 | -739 | 5,112 | -781 |
| − Dividends paid | 1,437 | 1,384 | 1,331 | 1,278 | 1,225 |
| − Share buybacks | 0 | 0 | 0 | 0 | 0 |
| = Free cash flow not paid out | 3,528 | ||||
| = Paid out more than the free cash flow | 3,098 | 3,380 | 2,367 | 2,330 | |
| Paid to shareholders | 1,437 | 1,384 | 1,331 | 1,278 | 1,225 |
What this means. The company's own net debt is higher because it also includes pension promises, cleanup obligations, long-term investments, and its own valuation adjustments.
What could change E.ON’s dividend?
Management guides 2026 adjusted EBITDA to €9.4–€9.6 billion and adjusted net income to €2.7–€2.9 billion, with adjusted EPS of €1.03–€1.11. It targets about €13 billion of adjusted EBITDA and €1.45 EPS in 2030, supported by roughly €48 billion of investment through 2030. Dividend growth can reach 5% annually. Management met five of five tracked promises; its 2025 EBITDA guide of €9.6–€9.8 billion landed at approximately €9.8 billion.
Cash conversion will decide whether earnings growth translates into shareholder returns. If operating cash remains insufficient after investment and dividends, debt rises and dividend growth slows. If regulated receipts improve before leverage becomes binding, the base case can move toward the bull case.
What is E.ON’s dividend yield against its share price?
| Today (Nov 1, 2026) | |
|---|---|
| Share price | 18.905 |
| P/E, next 12 months (calculated) | 15.1x |
| Free cash flow yield (calculated) | -2.7% |
| Real free cash flow yield (calculated) | -3.0% |
| Dividend yield (calculated) | 3.0% |
What this means. The negative free cash flow yields mean the company spent more cash than it generated recently, even though it still paid a dividend.