CSX earnings: what to watch
MyStockButler's October 2026 analysis: CSX's next results are expected on January 28, 2027. Watch whether better earnings become durable cash.
What has CSX guided for the year?
CSX’s July 22, 2026 guidance calls for full-year operating-margin expansion of more than 350 basis points. An operating margin is the share of revenue left after running the railroad: if CSX collects $100 and spends $80, the margin is 20%. A basis point is one hundredth of a percentage point, so 350 basis points means a 3.5-percentage-point improvement. The source of that improvement matters because lasting freight growth is stronger than temporary cost cutting.
The company also set a capital-spending ceiling of $2,400 million and a free-cash-flow growth floor of 80.0% for 2026. Free cash flow is the cash left after investment in tracks, locomotives and other property, before dividends. Completing reconstruction can therefore improve cash even before the railroad wins new business.
| Period guided | Low | High | Date given | |
|---|---|---|---|---|
| Operating margin expansion (basis points) | Year to Dec 2026 | 350 | Jul 22, 2026 | |
| Total capital expenditures | Year to Dec 2026 | 2,400 | Jul 22, 2026 | |
| Free Cash Flow growth | Year to Dec 2026 | 80.0% | Jul 22, 2026 | |
| Projects in service (projects) | Year to Dec 2026 | 100 | 100 | Apr 22, 2026 |
| Volume contribution | Year to Dec 2027 | 1.0% | 2.0% | Apr 22, 2026 |
| Net periodic pension benefit expense | Year to Dec 2026 | -5 | -5 | Feb 12, 2026 |
What this means. The negative five million dollar pension expense is a benefit, meaning it reduces the company's costs instead of increasing them.
Did CSX keep its past promises?
The capital-budget record supports a mixed grade rather than complete confidence.
| What management forecast | Checked | Above | Within | Below |
|---|---|---|---|---|
| Capital expenditures | 5 years | 2 | 1 | 2 |
What this means. The company met or exceeded its capital spending forecasts three times, but fell below them twice.
What is CSX's recent revenue and profit trend?
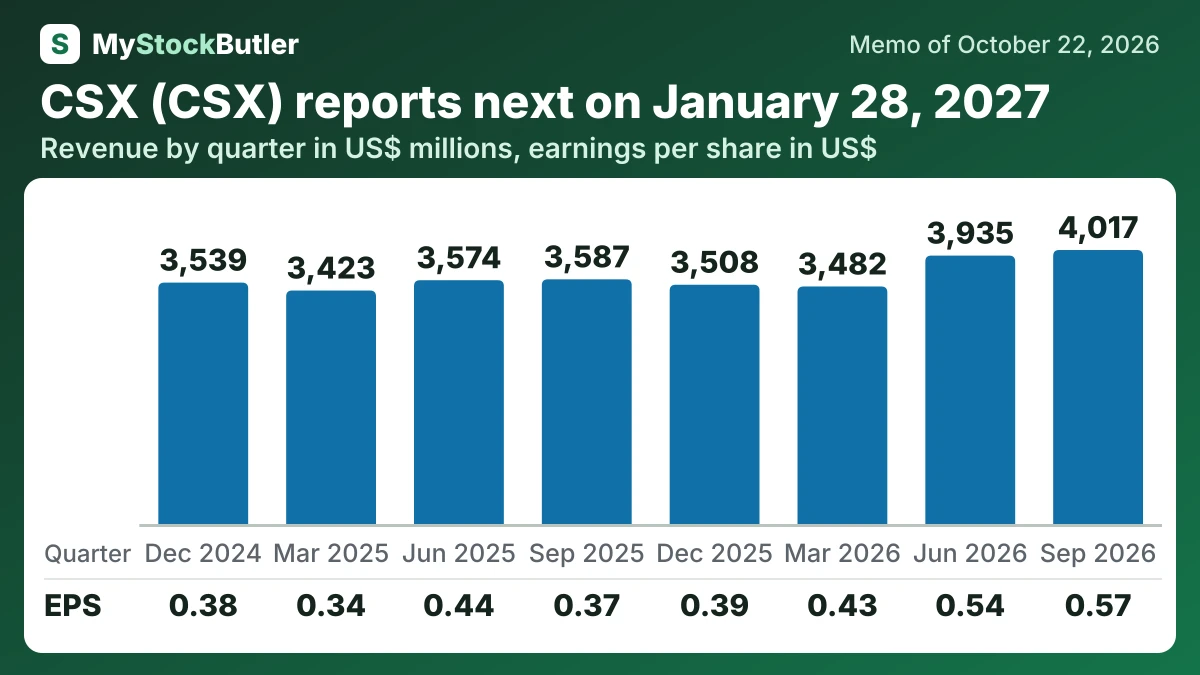
Revenue rose from $3,587 million to $4,017 million in the quarter ended September 2026. Operating income rose from $1,087 million to $1,570 million, while diluted EPS rose from $0.37 to $0.57. The earlier quarter included the $164 million Quality Carriers charge, so the cleaner comparison still shows strong improvement but less dramatic growth.
Cash confirms that this was not only an accounting rebound. Operating cash rose from $1,337 million to $1,617 million, while capital spending fell from $730 million to $593 million. Free cash flow therefore rose from $607 million to $1,024 million. The first three quarters of 2026 produced $2,504 million of free cash flow, compared with $1,002 million in the corresponding 2025 period.
| Sep 2026 | Jun 2026 | Mar 2026 | Dec 2025 | Sep 2025 | Jun 2025 | Mar 2025 | Dec 2024 | |
|---|---|---|---|---|---|---|---|---|
| Revenue | 4,017 | 3,935 | 3,482 | 3,508 | 3,587 | 3,574 | 3,423 | 3,539 |
| Operating income | 1,570 | 1,506 | 1,253 | 1,110 | 1,087 | 1,283 | 1,041 | 1,106 |
| Net income | 1,052 | 1,002 | 807 | 720 | 694 | 829 | 646 | 733 |
| EPS, diluted | 0.57 | 0.54 | 0.43 | 0.39 | 0.37 | 0.44 | 0.34 | 0.38 |
| Cash from operations | 1,617 | 1,327 | 1,272 | 1,386 | 1,337 | 635 | 1,255 | 1,388 |
| = Free cash flow | 1,024 | 751 | 729 | 709 | 607 | -141 | 536 | 550 |
What this means. Free cash flow was negative in June 2025 because the company spent more on equipment and buildings than it brought in from daily business that quarter.