CSX stock forecast 2027–2029
MyStockButler's October 2026 analysis: At October 2027, the weighted price is $53.80, rising to $63.79 at October 2029. CSX’s upside depends on turning service recovery and project traffic into durable cash generation.
Where could CSX's shares be by 2029?
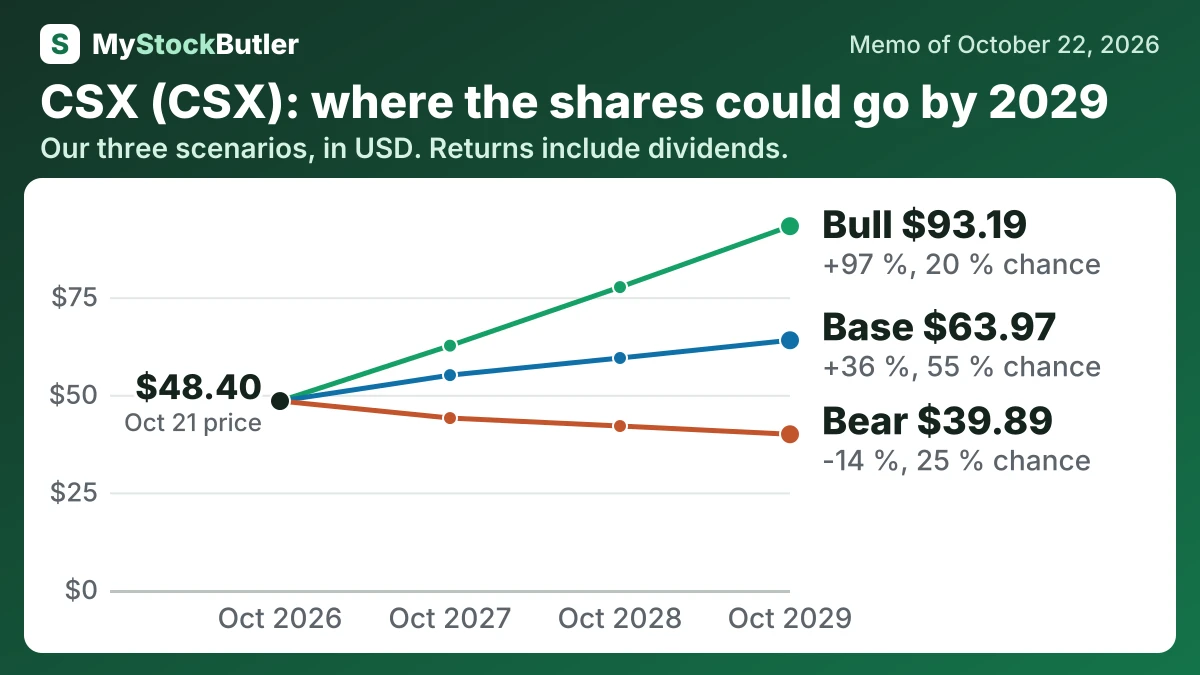
At the first forecast date, October 2027, the weighted price is $53.80. That is a 12% return including dividends. At the last forecast date, October 2029, the weighted price is $63.79. That is a 36% return including dividends. The forecast assigns 25% probability to the bear case. The base case receives 55%, and the bull case 20%.
| Case | Probability | October 2027 | October 2028 | October 2029 |
|---|---|---|---|---|
| Bear | 25 % | 44.04 (-8 %) | 42.00 (-11 %) | 39.89 (-14 %) |
| Base | 55 % | 55.04 (+15 %) | 59.43 (+25 %) | 63.97 (+36 %) |
| Bull | 20 % | 62.59 (+30 %) | 77.59 (+63 %) | 93.19 (+97 %) |
| Weighted | 100 % | 53.80 (+12 %) | 58.71 (+24 %) | 63.79 (+36 %) |
What this means. The weighted row is the probability-based average of the bear, base, and bull cases, not a separate prediction.
What has to go right or wrong for CSX?
The bear case requires weak coal and industrial traffic to combine with crew tightness, terminal dwell and poor schedule performance. EBITDA declines, buybacks slow and the multiple contracts. The shares reach $44.04 in October 2027 and $39.89 by October 2029. The forecast assigns this path 25% because fixed costs and cyclical freight make deterioration credible, although the latest cash improvement reduces the chance of a severe collapse.
The bull case requires projects and the Howard Street capacity to ramp quickly, service to win freight from trucks, and pricing to outpace costs. EBITDA reaches $9.5 billion, the multiple expands to 18 times and faster repurchases reduce the share count. The shares reach $62.59 first and $93.19 last. The probability is 20% because several execution-dependent outcomes must occur together.
How much cash does CSX really make?
In 2025, CSX generated $4,613 million from operations and spent $2,902 million on property, leaving $1,711 million of free cash flow. Deducting $54 million of stock compensation gives an analytical “real free cash flow” figure of $1,657 million. Stock pay is not a current cash bill, but it gives employees an economic claim that shareholders ultimately bear.
| 2025 | 2024 | 2023 | 2022 | 2021 | |
|---|---|---|---|---|---|
| Cash from operations | 4,613 | 5,247 | 5,514 | 5,526 | 5,099 |
| − Capital spending | 2,902 | 2,529 | 2,257 | 2,113 | 1,791 |
| = Free cash flow | 1,711 | 2,718 | 3,257 | 3,413 | 3,308 |
| − Stock pay | 54 | 40 | 60 | 74 | 107 |
| = Real free cash flow | 1,657 | 2,678 | 3,197 | 3,339 | 3,201 |
What does an investor pay for CSX today?
The price-to-earnings ratio, or P/E, says how many dollars investors pay for each dollar of annual profit. CSX’s trailing P/E is 25.1x, which implies about $1.93 of past-year earnings per share. Its forward P/E is 21.1x, implying about $2.29 of forecast earnings. The lower forward figure reflects a larger expected profit, not a guaranteed bargain: if investors later pay a lower multiple, the stock can fall even while earnings rise.
| Today (Oct 22, 2026) | |
|---|---|
| Share price | 48.40 |
| P/E, last 12 months (calculated) | 25.1x |
| P/E, next 12 months (calculated) | 21.1x |
| Free cash flow yield (calculated) | 1.9% |
| Real free cash flow yield (calculated) | 1.8% |
What this means. Enterprise value is higher than market value because it includes the company's debt after subtracting its cash, showing what it would cost to buy the whole business.