Norfolk Southern stock forecast 2027–2029
MyStockButler's October 2026 analysis: Norfolk Southern's weighted scenario is $345.70 in October 2027, $377.99 in October 2028 and $414.14 in October 2029. It hinges on operating recovery, cash generation and the proposed merger with Union Pacific.
Where could Norfolk Southern's shares go?
The forecast points to modest near-term upside, but a wide range of outcomes by the third year. The probability-weighted price is $345.70 in October 2027, $377.99 in October 2028 and $414.14 in October 2029, equal to total returns of 4%, 15% and 27% from today’s $338.23.
By October 2029, the bear case gives $245.83 while the bull case reaches $612.21. The base case is the central path because it assumes operating recovery without requiring a merger premium.
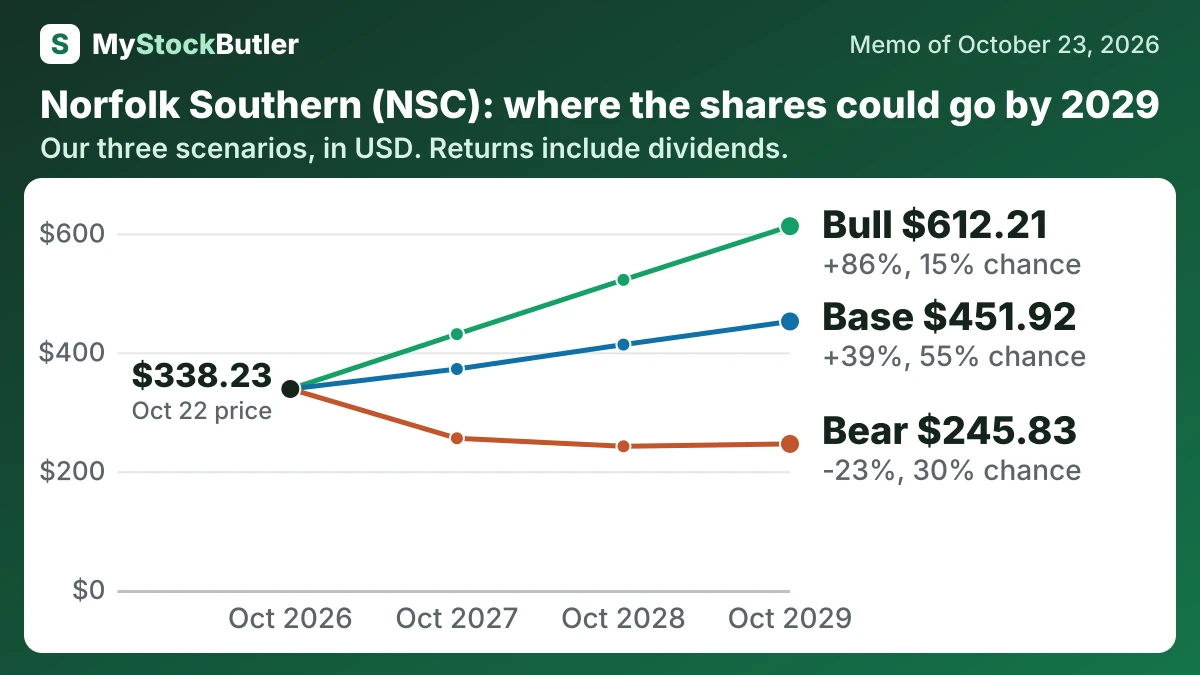
| Case | Probability | October 2027 | October 2028 | October 2029 |
|---|---|---|---|---|
| Bear | 30% | 255.27 (-23%) | 241.83 (-25%) | 245.83 (-23%) |
| Base | 55% | 371.89 (+12%) | 413.01 (+25%) | 451.92 (+39%) |
| Bull | 15% | 430.55 (+29%) | 521.91 (+58%) | 612.21 (+86%) |
| Weighted | 100% | 345.70 (+4%) | 377.99 (+15%) | 414.14 (+27%) |
What this means. The weighted row is the average expected share value after giving more influence to cases with higher probabilities.
What has to go right for Norfolk Southern, and what could go wrong?
The base case reaches $6,100M, $6,500M and $6,850M. Volume grew 3% in Q3, and reported productivity savings exceeded $215M. The bear case gives $5,350M, $5,500M and $5,750M because the operating ratio worsened by 210 basis points and fuel pressure reached $700M. The bull case gives $6,500M, $7,200M and $7,800M if service improves, savings recur and new capacity attracts profitable traffic. The merger itself adds no EBITDA.
A worsening operating ratio, further fuel pressure or service metrics below prior-year levels would move it toward the bear case. Claims that remain unresolved, capex above plan or capacity that fails to attract profitable shipments would also weaken cash flow and valuation.
How much cash does Norfolk Southern really make?
NS generates substantial operating cash, but capital spending and timing effects determine how much is genuinely available.
| 2025 | 2024 | 2023 | 2022 | 2021 | |
|---|---|---|---|---|---|
| Cash from operations | 4,361 | 4,052 | 3,179 | 4,222 | 4,255 |
| − Capital spending | 2,204 | 4,024 | 2,349 | 1,948 | 1,470 |
| = Free cash flow | 2,157 | 28 | 830 | 2,274 | 2,785 |
| − Stock pay | 63 | 40 | 40 | 53 | 54 |
| = Real free cash flow | 2,094 | -12 | 790 | 2,221 | 2,731 |
What does an investor pay for Norfolk Southern today?
| Today (Oct 23, 2026) | |
|---|---|
| Share price | 338.23 |
| Market value (calculated) | 75,972.10 |
| Enterprise value (calculated) | 90,987.10 |
| P/E, last 12 months (calculated) | 28.4x |
| P/E, next 12 months (calculated) | 23.6x |
| Free cash flow yield (calculated) | 2.8% |
What this means. The next 12 months price-to-earnings number uses analysts’ estimated profits, so it is not based on money the company has already earned.