Clorox earnings: date, guidance and results
MyStockButler's October 2026 analysis: Clorox reports its next results on November 2, 2026. Watch whether shipment growth becomes consumer demand and usable cash.
What has Clorox guided for FY2027?
The weighted forecast points to modest near-term upside and a larger return by October 2029 if demand, margins and cash improve and GOJO integrates successfully. Management guides FY2027 to 13%–14% reported sales growth, including a 9.5 percentage-point GOJO benefit. Organic growth is guided at 3.5%–4.5%, including at least 3.5 points from lapping the ERP drawdown.
Diluted EPS is guided at $5.41–$5.71. Adjusted EPS is guided at $5.70–$6.00. Acquisition and integration costs are expected to be $0.29 per diluted share. Free cash flow is guided at 11%–13% of net sales.
| Period guided | Low | High | Date given | |
|---|---|---|---|---|
| Net sales growth / (decrease) (GAAP) (%) | Year to Jun 2027 | 13.0% | 14.0% | Aug 3, 2026 |
| Organic sales growth / (decrease) (non-GAAP) (%) | Year to Jun 2027 | 3.5% | 4.5% | Aug 3, 2026 |
| Gross margin (%) | Year to Jun 2027 | 42.0% | 42.0% | Aug 3, 2026 |
| Diluted EPS | Year to Jun 2027 | 5.41 | 5.71 | Aug 3, 2026 |
| Adjusted EPS | Year to Jun 2027 | 5.70 | 6.00 | Aug 3, 2026 |
| Free cash flow as a percentage of net sales (%) | Year to Jun 2027 | 11.0% | 13.0% | Aug 3, 2026 |
What this means. The reported organic sales growth is not all underlying business growth because it includes a boost from comparing with last year's enterprise resource planning inventory drawdown.
Has Clorox kept its past promises?
Management’s forecasting record is mixed. It has beaten initial gross-margin and adjusted-EPS guidance three times in five years, but it has also cut forecasts after inflation, cyber disruption, currency movements, early shipments and execution pressures complicated comparisons.
| What management forecast | Checked | Above | Within | Below |
|---|---|---|---|---|
| Net sales | 5 years | 2 | 2 | 1 |
| Gross margin | 5 years | 3 | 0 | 2 |
| Adjusted EPS | 5 years | 3 | 0 | 2 |
What this means. The “Promises kept: 3/5” total is unclear because the table lists three different forecasts, each checked over five years.
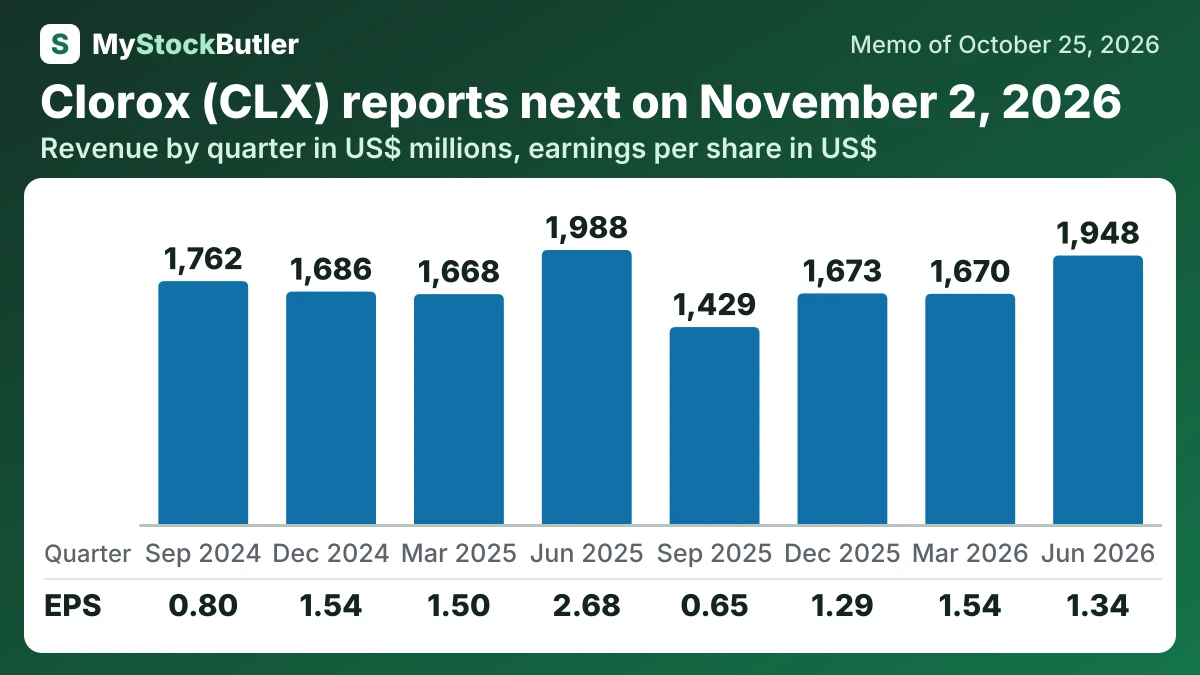
What has Clorox's revenue and profit done in the last eight quarters?
The June 2026 quarter showed signs of stabilizing demand, but acquisition accounting and weak margins produced a substantial profit decline.
| Jun 2026 | Mar 2026 | Dec 2025 | Sep 2025 | Jun 2025 | Mar 2025 | Dec 2024 | Sep 2024 | |
|---|---|---|---|---|---|---|---|---|
| Revenue | 1,948 | 1,670 | 1,673 | 1,429 | 1,988 | 1,668 | 1,686 | 1,762 |
| Gross margin | 41.3% | 43.2% | 43.2% | 41.7% | 46.5% | 44.6% | 43.8% | 45.8% |
| Operating income | 267 | 279 | 239 | 128 | 430 | 275 | 257 | 195 |
| Net income | 163 | 187 | 157 | 80 | 332 | 186 | 193 | 99 |
| EPS, diluted | 1.34 | 1.54 | 1.29 | 0.65 | 2.68 | 1.50 | 1.54 | 0.80 |
| = Free cash flow | 244 | -165 | 269 | 57 | 219 | 233 | 127 | 182 |
What this means. The cash flow numbers for most quarters are calculated by subtracting earlier year-to-date totals, so the negative March free cash flow does not necessarily mean the company lost money that quarter.
What should I watch in Clorox's next results?
The next results must show whether shipment growth is becoming consumer demand and usable cash. Clorox reports first-quarter FY2027 results on November 2, 2026, for the quarter ending September 2026.