Church & Dwight stock forecast 2027–2029
MyStockButler's October 2026 analysis: The weighted scenario keeps Church & Dwight near today's level through October 2029. It hinges on turning brand growth into profitable, durable cash generation.
Where could Church & Dwight's shares be by 2029?
The October 2029 range is $67.29 to $155.20. Today’s price is $104.97. The bear case has a 30% probability, the base case 50% and the bull case 20%.
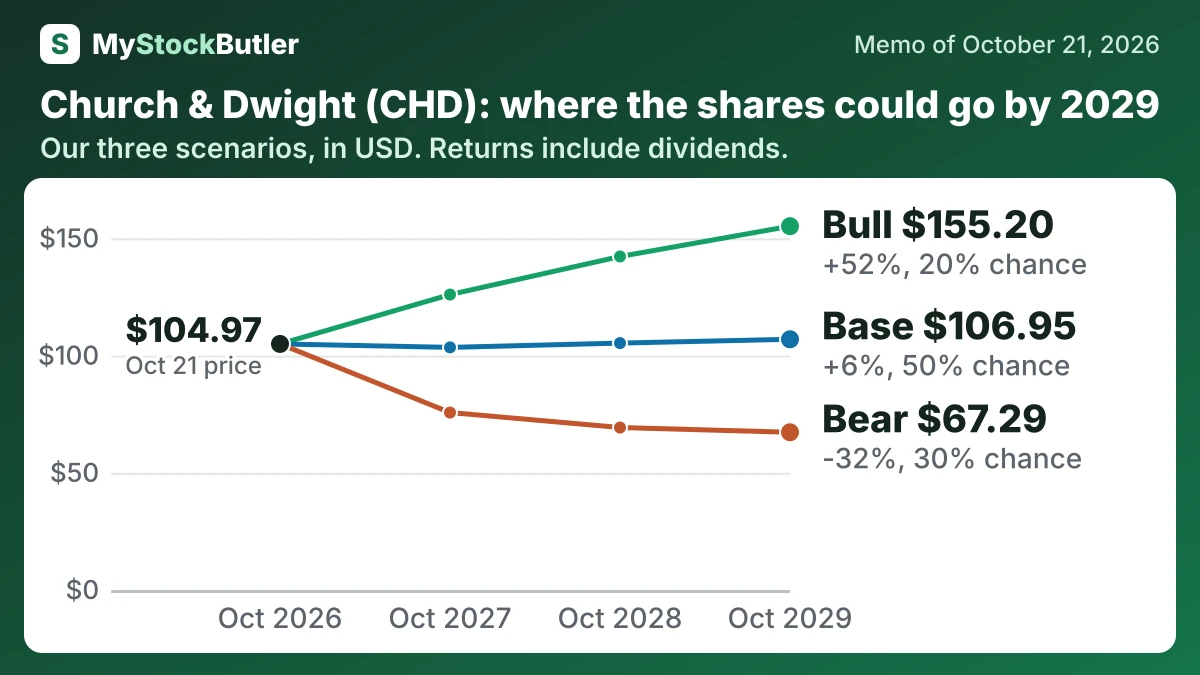
| Case | Probability | October 2027 | October 2028 | October 2029 |
|---|---|---|---|---|
| Bear | 30% | 75.69 (-27%) | 69.31 (-32%) | 67.29 (-32%) |
| Base | 50% | 103.50 (-0%) | 105.33 (+3%) | 106.95 (+6%) |
| Bull | 20% | 126.03 (+21%) | 142.27 (+38%) | 155.20 (+52%) |
| Weighted | 100% | 99.66 (-4%) | 101.91 (-0%) | 104.70 (+3%) |
What this means. The weighted row is the probability-based average of the bear, base, and bull estimates, not a separate forecast.
What could go right or wrong for Church & Dwight?
The bear case requires the 2026 volume recovery to fade. Slower categories, private-label pressure and lost distribution weaken sales, while marketing and acquisition costs prevent margin expansion. Lower cash generation limits buybacks, and disappointing earnings prompt multiple compression. The price falls from $75.69 in October 2027 to $67.29 in October 2029. Its probability is 30% because domestic organic sales fell 0.5% in 2025 and Q2 adjusted operating income declined despite strong organic growth.
The bull case requires TheraBreath, Hero and Arm & Hammer to sustain share gains and repeat demand. International expansion, productivity and better acquisition returns lift both earnings and cash flow, allowing the market to retain a premium multiple. The price rises from $126.03 to $155.20. Its probability is 20% because dollar share does not yet prove unit growth, and public data does not establish durable returns across every acquisition.
How much cash does Church & Dwight really make?
Stock compensation is an owner cost even when it does not immediately use cash. It gives employees part of the company or requires repurchases to offset dilution. Deducting $58.0 million of stock pay leaves analytical “real free cash flow” of $1,035.0 million.
| 2025 | 2024 | 2023 | 2022 | 2021 | |
|---|---|---|---|---|---|
| Cash from operations | 1,215.4 | 1,156.2 | 1,030.6 | 885.2 | 993.8 |
| − Capital spending | 122.4 | 179.8 | 223.5 | 178.8 | 118.8 |
| = Free cash flow | 1,093.0 | 976.4 | 807.1 | 706.4 | 875.0 |
| − Stock pay | 58.0 | 59.2 | 63.6 | 32.3 | 23.7 |
| = Real free cash flow | 1,035.0 | 917.2 | 743.5 | 674.1 | 851.3 |
What this means. The company's own free cash flow matches our count, but real free cash flow is lower because shares given to employees reduce existing investors' ownership even though no cash was paid.
What does an investor pay for Church & Dwight today?
At $104.965 a share on October 21, 2026, the equity—the value belonging to shareholders—was $24,898.1 million. The trailing P/E was 33.8 times. That means investors paid $33.80 for each dollar of the company’s past-year profit. Its inverse, the earnings yield, was 3.0%: an accounting return, not cash automatically received. The forward multiple uses expected earnings instead, so it depends on profits that have not arrived.
| Today (Oct 21, 2026) | |
|---|---|
| Share price | 104.965 |
| Market value (calculated) | 24,898.1 |
| Enterprise value (calculated) | 26,899.5 |
| P/E, last 12 months (calculated) | 33.8x |
| Free cash flow yield (calculated) | 4.4% |
| Real free cash flow yield (calculated) | 4.2% |
What this means. The next-year price-to-earnings number uses analysts’ estimated profit, so it is a forecast rather than a known result.