Church & Dwight dividend
MyStockButler's October 2026 analysis: Church & Dwight's base dividend path increases roughly 4% each January, producing $1.2675 per share in October 2027 and $1.3675 in October 2029. Church & Dwight generated $1,093.0 million of free cash flow against $287.2 million of dividends in 2025, although Church & Dwight also spent $900.0 million on buybacks.
How much does Church & Dwight pay per share?
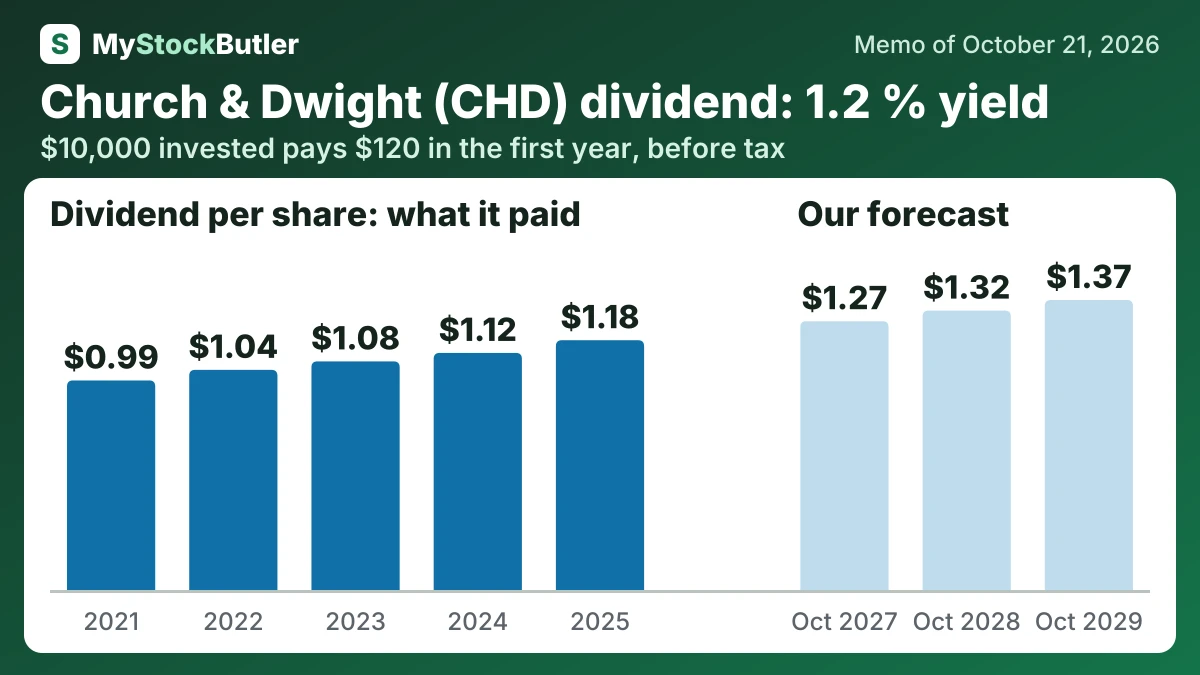
The base dividend path increases roughly 4% each January, producing $1.2675 per share in October 2027 and $1.3675 in October 2029. The bear freezes the annualized rate at $1.23, while the bull assumes 6% annual increases and reaches $1.4441. The base is supported by the 4.2% increase declared for 2026 and the steady record from 2021 through 2025.
| October 2027 | October 2028 | October 2029 | |
|---|---|---|---|
| Earnings | 982 (900 / 1,030) | 1,041 (918 / 1,123) | 1,103 (946 / 1,224) |
| Shares (millions) | 237 (238 / 237) | 237 (238 / 237) | 237 (239 / 237) |
| Dividends per share | 1.27 (1.23 / 1.29) | 1.32 (1.23 / 1.36) | 1.37 (1.23 / 1.44) |
| Price to earnings | 25.00 (20.00 / 29.00) | 24.00 (18.00 / 30.00) | 23.00 (17.00 / 30.00) |
How much would Church & Dwight's dividend pay you?
$10,000 invested in Church & Dwight at its 1.2% dividend yield (our report of October 21, 2026) pays $120.00 in the first year, before tax. If its dividend per share keeps changing 4.5% a year, as it did from 2021 to 2025, and the dividends are reinvested, year 10 pays $202.58, with $1,575.16 received in all.
Before tax. Past dividend growth is not a promise. Information only, not investment advice.
Is Church & Dwight's dividend covered by its cash?
Operating cash was $1,215.4 million in 2025. After $122.4 million of capital spending, free cash flow was $1,093.0 million. That exceeded net income because amortization and impairments reduce accounting profit without requiring the same current cash payment.
Cash then went to shareholders and acquisitions. Buybacks were $900.0 million in 2025, and dividends were $287.2 million. TOUCHLAND required $656.0 million of cash at closing. Cash consequently fell while debt changed little, showing the difference between cash produced by the brands and cash left after buying the portfolio.
| 2025 | 2024 | 2023 | 2022 | 2021 | |
|---|---|---|---|---|---|
| Free cash flow | 1,093.0 | 976.4 | 807.1 | 706.4 | 875.0 |
| − Dividends paid | 287.2 | 277.0 | 266.5 | 255.0 | 247.5 |
| − Share buybacks | 900.0 | 0 | 300.1 | 0 | 500.0 |
| = Free cash flow not paid out | 699.4 | 240.5 | 451.4 | 127.5 | |
| = Paid out more than the free cash flow | 94.2 | ||||
| Paid out, % of free cash flow | 108.6% | 28.4% | 70.2% | 36.1% | 85.4% |
What this means. In 2025, the company paid shareholders more cash than it generated, so it had to use savings or borrowing and its debt increased.
What could change Church & Dwight's dividend?
From 2027 through 2029, persistently subdued category growth, greater private-label pressure or weaker Waterpik economics would reduce revenue, margins and the valuation multiple. Persistent integration costs, rising net debt or weaker cash conversion would also reduce buybacks and challenge the dividend path.
What is Church & Dwight's dividend yield today?
Free cash flow is cash left after running the business and paying for equipment and other capital spending. Its yield was 4.4%, while the dividend yield was 1.2%. In 2025, operating cash flow less capital spending left $1,093.0 million, against $287.2 million of dividends. Management could use the rest for acquisitions, debt repayment, or repurchases. In the first half of 2026, it spent $300.0 million on Miss Mouth’s Messy Eater and $180.5 million on earlier acquisition obligations.
| Today (Oct 21, 2026) | |
|---|---|
| Share price | 104.965 |
| Free cash flow yield (calculated) | 4.4% |
| Real free cash flow yield (calculated) | 4.2% |
| Dividend yield (calculated) | 1.2% |
What this means. The next-year price-to-earnings number uses analysts’ estimated profit, so it is a forecast rather than a known result.