Brown–Forman earnings date and guidance
MyStockButler's October 2026 analysis: Brown–Forman next results are expected on December 3, 2026. Watch repeat demand, Canadian access and the leadership transition.
What has Brown–Forman guided for the year?
On September 2, 2026, management reaffirmed organic net sales growth of 0.0% and an organic operating income decline of 3.0%–5.0%. Flat sales can still produce less profit because costs rise: if sales are $100 and costs increase from $80 to $84, operating income falls from $20 to $16. Brown–Forman’s outlook therefore signals pressure on costs or margins, even as new products support revenue.
The fiscal 2027 capital expenditure plan is $60 million–$70 million. The first-quarter outlay was $12 million, leaving most of the plan for the remaining nine months; management has not said it will spend the balance evenly. Lower construction spending helps cash, but it is valuable only if the existing capacity is sufficient for future demand.
| Period guided | Low | High | Date given | |
|---|---|---|---|---|
| Organic net sales | Year to Apr 2027 | 0.0% | 0.0% | Sep 2, 2026 |
| Organic operating income | Year to Apr 2027 | -5.0% | -3.0% | Sep 2, 2026 |
| Effective tax rate | Year to Apr 2027 | 20.0% | 22.0% | Sep 2, 2026 |
| Capital expenditures | Year to Apr 2027 | 60 | 70 | Sep 2, 2026 |
What this means. The zero percent sales figure means sales are expected to be roughly unchanged, not guaranteed to be exactly the same.
Did Brown–Forman keep its promises?
The guidance record earns a 3/5 credibility score. Across four checked years, sales finished above the original expectation twice and below it twice; none landed within the range. Actual capital spending also fell below its initial range in four of five checked years. The forecasts are useful, but they are not dependable minimums.
| What management forecast | Checked | Above | Within | Below |
|---|---|---|---|---|
| Organic net sales growth | 4 years | 2 | 0 | 2 |
| Organic operating income growth | 4 years | 1 | 2 | 1 |
| Effective tax rate | 5 years | 1 | 2 | 2 |
| Capital expenditures | 5 years | 0 | 1 | 4 |
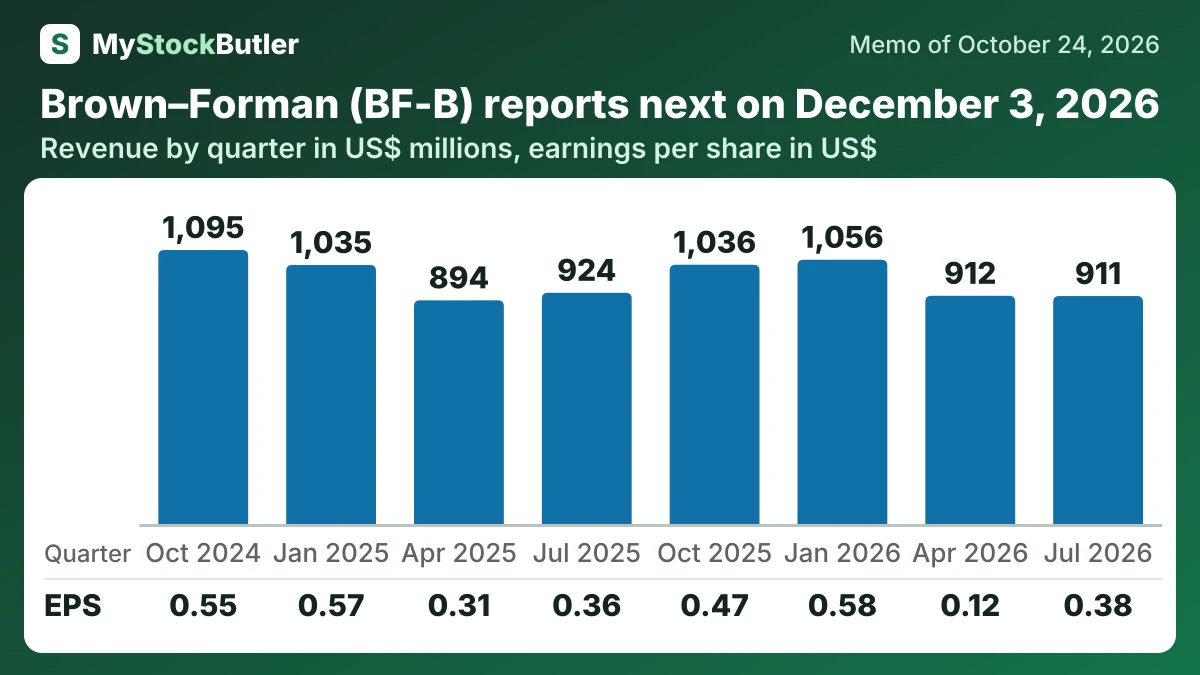
What do Brown–Forman’s last eight quarters show?
Revenue and operating income fell from the year-earlier quarter, while net income and diluted EPS rose. Lower non-operating postretirement expense helped net income, and earlier repurchases spread earnings across fewer shares. EPS therefore improved without stronger sales or operating profit.
| Jul 2026 | Apr 2026 | Jan 2026 | Oct 2025 | Jul 2025 | Apr 2025 | Jan 2025 | Oct 2024 | |
|---|---|---|---|---|---|---|---|---|
| Revenue | 911 | 912 | 1,056 | 1,036 | 924 | 894 | 1,035 | 1,095 |
| Operating income | 252 | 96 | 340 | 305 | 260 | 205 | 280 | 341 |
| Net income | 176 | 54 | 267 | 224 | 170 | 146 | 270 | 258 |
| EPS, diluted | 0.38 | 0.12 | 0.58 | 0.47 | 0.36 | 0.31 | 0.57 | 0.55 |
| Cash from operations | 173 | 291 | 417 | 132 | 160 | 152 | 317 | 112 |
| = Free cash flow | 161 | 265 | 392 | 107 | 129 | 102 | 272 | 81 |
What this means. The cash from operations figures are for individual quarters, even though some are calculated by subtracting earlier year-to-date figures from later ones.
What should I watch in Brown–Forman’s next results?
Leadership adds another uncertainty. Lawson Whiting will retire when a successor is appointed, after a search involving internal and external candidates. The board also rejected an unsolicited Sazerac proposal as not actionable, while the Brown family’s voting group supported independence. The decisive test is whether the next leadership team turns existing capacity and new products into repeat demand, cash and durable earnings.