Atmos Energy stock forecast 2027–2029
MyStockButler's October 2026 analysis: Atmos Energy's weighted forecast reaches $168.97 in October 2027. Atmos Energy's outlook hinges on timely rate recovery.
Where could Atmos Energy's shares be in the forecast?
The weighted forecast is for modest appreciation in the first year and stronger gains by the third. The weighted price is $168.97 in October 2027, a 4% total return including dividends. It reaches $178.34 in October 2028, a 12% return. By October 2029, it reaches $189.76, a 22% return.
The first forecast point carries a +4% return including dividends. The final point is US$189.76 in October 2029, a +22% return. Bear-case probability is 25%; base-case probability is 55%. Bull-case probability is 20%. The base case assumes continued execution, moderate dilution and no multiple expansion.
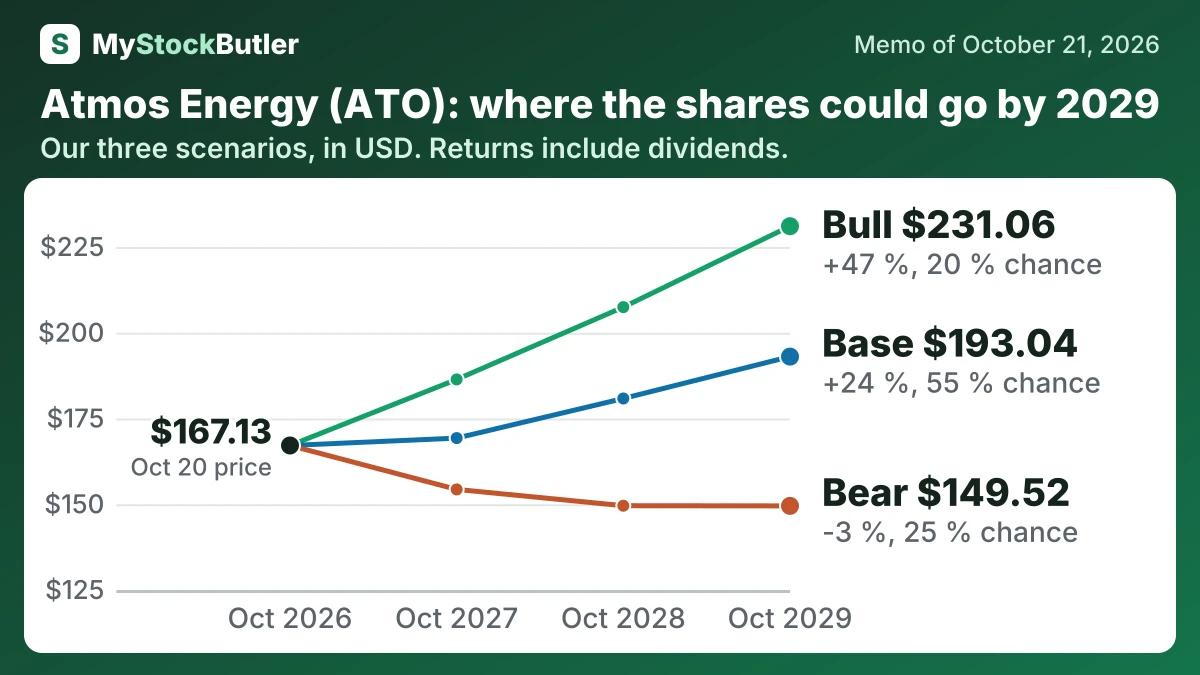
| Case | Probability | October 2027 | October 2028 | October 2029 |
|---|---|---|---|---|
| Bear | 25 % | 154.32 (-5 %) | 149.57 (-6 %) | 149.52 (-3 %) |
| Base | 55 % | 169.29 (+4 %) | 180.83 (+13 %) | 193.04 (+24 %) |
| Bull | 20 % | 186.39 (+14 %) | 207.47 (+30 %) | 231.06 (+47 %) |
| Weighted | 100 % | 168.97 (+4 %) | 178.34 (+12 %) | 189.76 (+22 %) |
What this means. The Weighted row is the probability-based average of the bear, base, and bull outcomes, not a separate fourth case.
What has to go right or wrong for Atmos Energy?
The bear case reaches $1,867 million because recovery delays, Jackson follow-up costs, financing expense and slower APT growth hold EPS below the base path. The bull case reaches $2,068 million because prompt rate recovery, industrial demand and contracted APT activity lift earnings above plan. Recent APT operating-income growth supports that possibility.
How much cash does Atmos Energy really make?
Capital spending was 3,561,399 in FY2025. Against operating cash flow, that produced free cash flow of negative 1,511,943. Subtracting stock compensation gives analytical “real free cash flow” of negative 1,524,674. Dividends add to the funding requirement, even though accounting earnings cover them.
| Sep 2025 | Sep 2024 | Sep 2023 | Sep 2022 | Sep 2021 | |
|---|---|---|---|---|---|
| Cash from operations | 2,049,456 | 1,733,746 | 3,459,743 | 977,584 | -1,084,251 |
| − Capital spending | 3,561,399 | 2,937,124 | 2,805,973 | 2,444,420 | 1,969,540 |
| = Free cash flow | -1,511,943 | -1,203,378 | 653,770 | -1,466,836 | -3,053,791 |
| − Stock pay | 12,731 | 10,709 | 10,178 | 10,743 | 11,255 |
| = Real free cash flow | -1,524,674 | -1,214,087 | 643,592 | -1,477,579 | -3,065,046 |
What this means. The unusually high cash from operations in 2023 includes money released after Texas securitized Winter Storm Uri costs, so it does not all reflect normal business activity.
What does an investor pay for Atmos Energy today?
P/E means share price divided by annual earnings per share; forward P/E uses estimated future earnings. Atmos trades at 19.9x recent earnings and 18.5x expected earnings. Those multiples imply about $8.40 of recent earnings per share and $9.03 of expected earnings per share. Paying $20 for a shop that earns $1 can be sensible if profits are dependable, but risky if the shop must borrow heavily to expand.
| Today (Oct 20, 2026) | |
|---|---|
| Share price | 167.13 |
| Market value (calculated) | 28,243,057 |
| Enterprise value (calculated) | 38,045,971 |
| P/E, last 12 months (calculated) | 19.9x |
| P/E, next 12 months (calculated) | 18.5x |
| Real free cash flow yield (calculated) | -5.4% |
What this means. The negative free cash flow yield means the company spent more cash than it generated during the latest year.