NiSource stock forecast 2027–2029
MyStockButler's October 2026 analysis: NiSource's weighted price is $43.70 by October 2027 and $54.04 by October 2029. It hinges on growth becoming recoverable, financeable cash per share.
Where could NiSource's shares be by October 2029?
The weighted price is $43.70 by October 2027, a 3% return, and $54.04 by October 2029, a 33% return including dividends. Probabilities are 30% bear, 50% base and 20% bull.
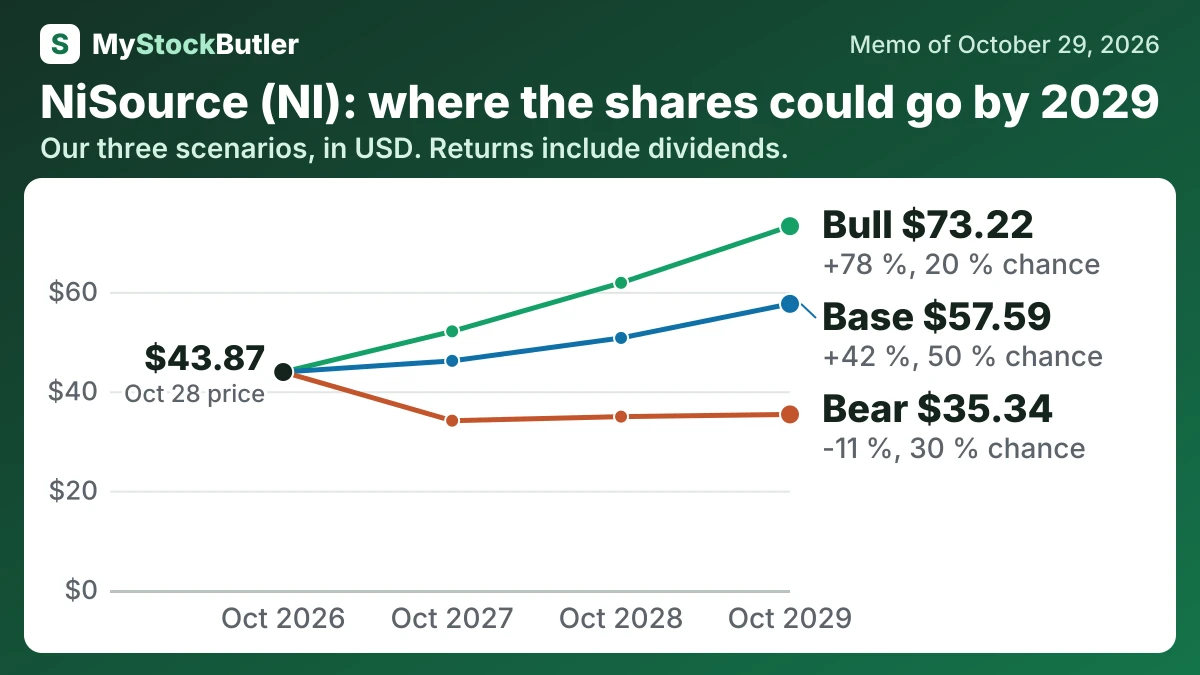
| Case | Probability | October 2027 | October 2028 | October 2029 |
|---|---|---|---|---|
| Bear | 30 % | 34.08 (-20 %) | 34.89 (-15 %) | 35.34 (-11 %) |
| Base | 50 % | 46.12 (+8 %) | 50.73 (+22 %) | 57.59 (+42 %) |
| Bull | 20 % | 52.06 (+22 %) | 61.82 (+48 %) | 73.22 (+78 %) |
| Weighted | 100 % | 43.70 (+3 %) | 48.19 (+16 %) | 54.04 (+33 %) |
What has to go right or wrong for NiSource?
Indiana’s gas-plan denial and Schahfer’s December 18, 2026 order expiration test recovery and replacement power. A proposed $5 monthly residential electric credit for 18 months tests whether data-center development benefits existing customers. Microsoft approval is sought in the first half of 2027; capacity service begins in 2028 and reaches 788 MW in 2031. More than 90% of investment must enter initial recovery within 12 months, and GenCo must meet its contribution plan. NiSource’s growth only matters when it becomes recoverable, financeable cash per share.
The bear story is that regulators constrain investment recovery, GenCo projects run late or over budget, and negative free cash flow forces more equity issuance. Earnings grow below guidance while the multiple falls. The share price reaches $34.08 in the first period and $35.34 in the final period, with dividends added separately when calculating returns. The probability is 30% because the Indiana denial and recurring financing needs are established risks.
How much cash does NiSource really make?
Negative free cash flow is not automatically failure for a utility. NiSource pays contractors today for pipes, wires and plants, while regulators may allow recovery over many future years. Subtracting stock pay gives a stricter view because employee equity still represents an economic cost, even though it is not a cash capital expenditure.
| 2025 | 2024 | 2023 | 2022 | 2021 | |
|---|---|---|---|---|---|
| Cash from operations | 2,362.3 | 1,781.5 | 1,935.1 | 1,409.4 | 1,217.9 |
| − Capital spending | 4,254.8 | 3,125.0 | 3,407.2 | 2,527.0 | 2,078.4 |
| = Free cash flow | -1,892.5 | -1,343.5 | -1,472.1 | -1,117.6 | -860.5 |
| − Stock pay | 50.9 | 43.6 | 33.5 | 24.9 | 24.3 |
| = Real free cash flow | -1,943.4 | -1,387.1 | -1,505.6 | -1,142.5 | -884.8 |
| Real free cash flow, % of revenue | -29.3% | -25.4% | -27.3% | -19.5% | -18.1% |
What this means. Capital spending includes project deposits and renewable project milestone or final payments, not just equipment and buildings.
What is NiSource's price against earnings and cash?
The price-to-earnings ratio, or P/E, shows how much investors pay for one dollar of annual profit. NiSource trades at 22.5 times its last twelve months’ earnings, implying about $1.95 of earnings per share, and at 19.5 times expected next-twelve-month earnings, implying about $2.25. The forward figure is a forecast; management’s 2027 adjusted-EPS guidance is $2.22–$2.30.
| Today (Oct 29, 2026) | |
|---|---|
| Share price | 43.87 |
| P/E, last 12 months (calculated) | 22.5x |
| P/E, next 12 months (calculated) | 19.5x |
| EV / revenue, last 12 months (calculated) | 5.6x |
| Price to book (calculated) | 2.2x |
| Real free cash flow yield (calculated) | -9.2% |