Ameren earnings date and guidance
MyStockButler's October 2026 analysis: Ameren’s next results are expected on November 5, 2026. Watch whether Ameren converts investment into cash without excessive dilution or regulatory delay.
What has Ameren guided for the year?
Ameren’s 2026 earnings guidance remains in force, alongside a promise of annual EPS growth of 6.0%–8.0% from 2026 through 2030 and annual rate-base growth of 10.6% from 2025 through 2030. EPS is profit attributable to each share; diluted EPS includes potential additional shares. Rate base is the value of utility assets regulators allow Ameren to recover from customers while earning an approved return.
| Period guided | Low | High | Date given | |
|---|---|---|---|---|
| Earnings per diluted share (US$) — Year to Dec 2026 | Year to Dec 2026 | 5.25 | 5.45 | Jul 30, 2026 |
| Ameren — estimated capital expenditures — Year to Dec 2026 | Year to Dec 2026 | 5,520 | 5,520 | Feb 18, 2026 |
| EPS compound annual growth rate — 2026 through 2030 | 2026 through 2030 | 6.0% | 8.0% | Feb 11, 2026 |
| Projected rate base growth, compounded annually — 2025 through 2030 | 2025 through 2030 | 10.6% | 10.6% | Feb 11, 2026 |
| Dividend payout ratio — Next few years, including 2026 | Next few years, including 2026 | 50.0% | 60.0% | Aug 3, 2026 |
What this means. Ameren's guided capital spending is not the same as cash it will pay because it also includes an accounting allowance for financing construction.
Has Ameren kept its past promises?
The checked record is mixed rather than flawless. A 2024 EPS miss included $0.21 per share of Rush Island mitigation and transmission-refund charges, while a 2025 beat benefited from $0.32 per share of discrete tax benefits. Effective tax-rate estimates missed their ranges in all four checked years, and transmission rate-base estimates were later reduced. The promise is meaningful, but analysts must distinguish an original forecast from a revised one.
| What management forecast | Checked | Above | Within | Below |
|---|---|---|---|---|
| Diluted Earnings Per Share (EPS) | 5 years | 1 | 3 | 1 |
| Estimated effective income tax rate | 4 years | 3 | 0 | 1 |
| Ameren Transmission — average estimated rate base | 5 years | 0 | 4 | 1 |
What this means. The “Promises kept: 3/5” summary is not the total of the three rows, which together show fourteen forecasts.
What is Ameren’s revenue and profit trend?
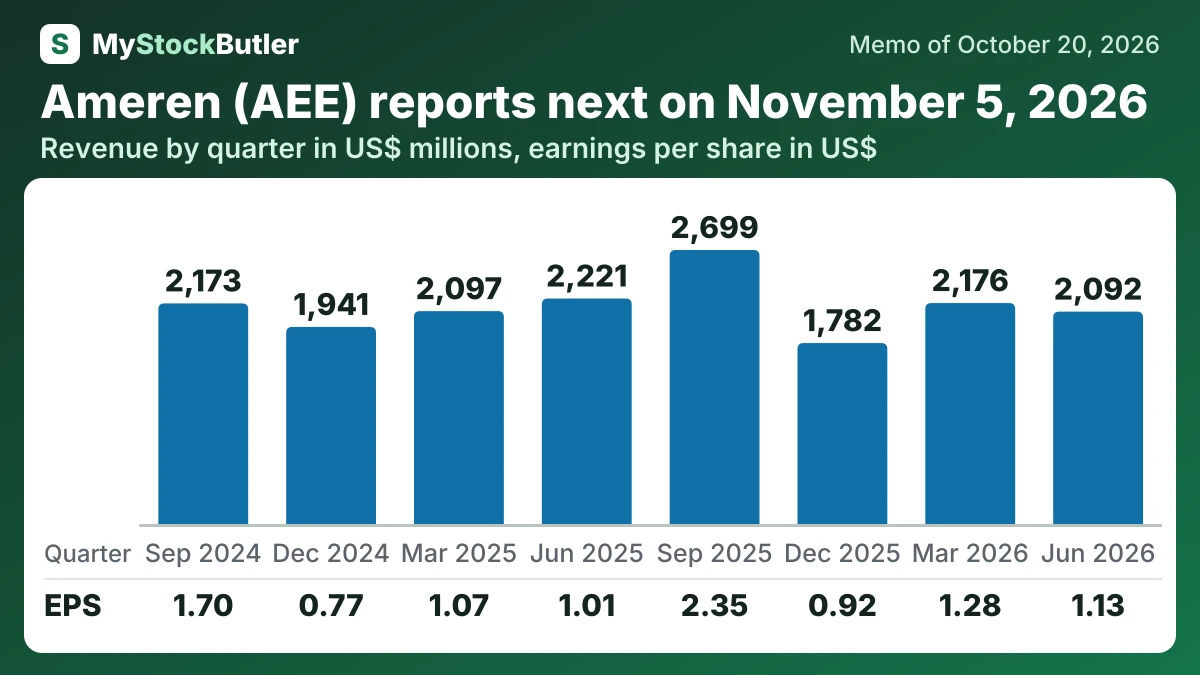
Revenue declined 5.8% to $2,092 million compared with June 2025. Operating income rose 11.7% to $459 million. Gross margin increased from 62.5% to 73.9% because Missouri off-system and capacity revenue fell from $471 million to $148 million while retail revenue increased. A smaller wholesale line did not prevent operating profit from rising.
| Jun 2026 | Mar 2026 | Dec 2025 | Sep 2025 | Jun 2025 | Mar 2025 | Dec 2024 | Sep 2024 | |
|---|---|---|---|---|---|---|---|---|
| Revenue | 2,092 | 2,176 | 1,782 | 2,699 | 2,221 | 2,097 | 1,941 | 2,173 |
| Operating income | 459 | 532 | 360 | 825 | 411 | 430 | 198 | 586 |
| Net income | 314 | 357 | 252 | 640 | 275 | 289 | 207 | 456 |
| EPS, diluted | 1.13 | 1.28 | 0.92 | 2.35 | 1.01 | 1.07 | 0.77 | 1.70 |
What this means. The gross margin here is only what remains after fuel, purchased power, and natural gas bought for resale, so it is not the profit left after all of the company's costs.
What should I watch in Ameren’s next results?
The next evidence is whether Ameren converts investment into cash without excessive dilution or regulatory delay.