Ameren dividend: cash coverage and yield
MyStockButler's October 2026 analysis: Ameren pays an annualized dividend of $3.00 a share. Its free cash flow was negative $821 million before dividends in 2025, so free cash flow did not cover the dividend.
How much does Ameren pay per share?
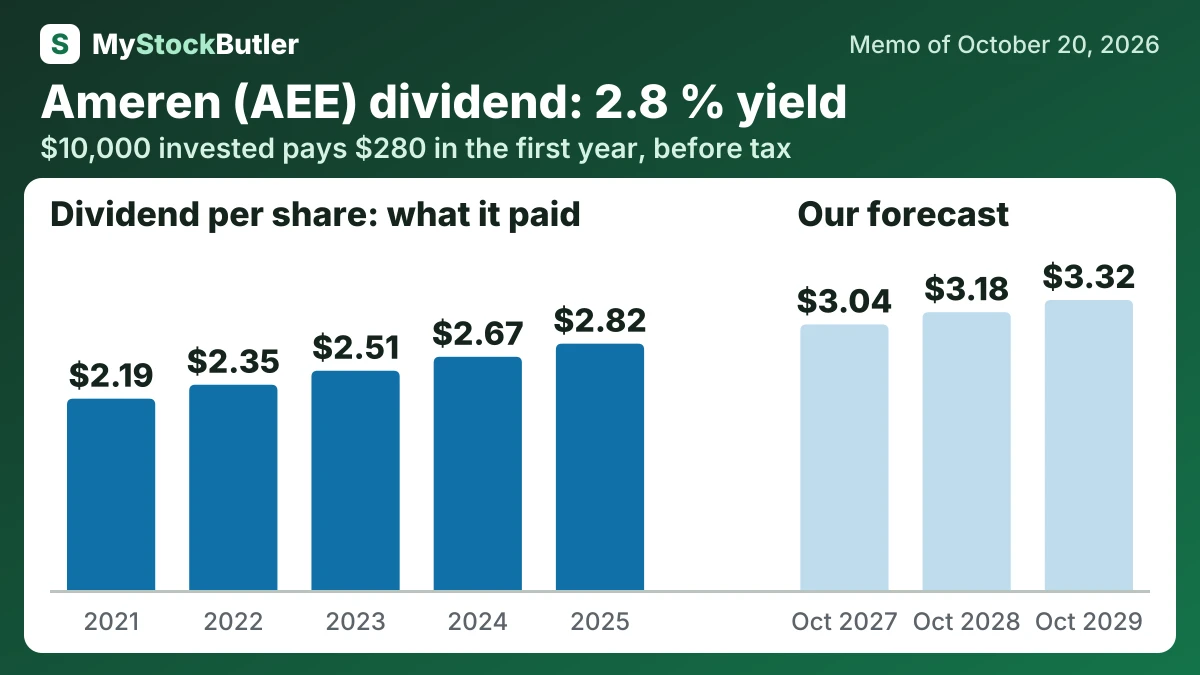
| 2025 | 2024 | 2023 | 2022 | 2021 | |
|---|---|---|---|---|---|
| EPS, diluted | 5.35 | 4.42 | 4.38 | 4.14 | 3.84 |
| Real free cash flow per share | -3.12 | -6.26 | -4.68 | -4.40 | -7.31 |
| − Dividends paid, per share | 2.82 | 2.67 | 2.51 | 2.35 | 2.19 |
| − Share buybacks, per share | 0.00 | 0.00 | 0.00 | 0.00 | 0.00 |
How much would Ameren's dividend pay you?
$10,000 invested in Ameren at its 2.8% dividend yield (our report of October 20, 2026) pays $280.00 in the first year, before tax. If its dividend per share keeps changing 6.5% a year, as it did from 2021 to 2025, and the dividends are reinvested, year 10 pays $683.00, with $4,493.15 received in all.
Before tax. Past dividend growth is not a promise. Information only, not investment advice.
Does Ameren’s dividend have cash coverage?
Ameren still raised cash dividends from $565 million in 2021 to $768 million in 2025 and made no share buybacks during the five years. Dividends returned cash to shareholders, but they enlarged the amount Ameren had to raise elsewhere. Because free cash flow was negative, a payout percentage based on it was not meaningful; the important question was how the investment and dividend bill was funded.
| 2025 | 2024 | 2023 | 2022 | 2021 | |
|---|---|---|---|---|---|
| Free cash flow | -821 | -1,647 | -1,207 | -1,117 | -1,862 |
| − Dividends paid | 768 | 714 | 662 | 610 | 565 |
| − Share buybacks | 0 | 0 | 0 | 0 | 0 |
| = Paid out more than the free cash flow | 1,594 | 2,366 | 1,874 | 1,732 | 2,432 |
| Paid out, % of free cash flow | not meaningful | not meaningful | not meaningful | not meaningful | not meaningful |
What this means. The company paid dividends despite negative free cash flow, covering the shortfall with borrowing, new shares, and other cash sources.
What could change Ameren’s dividend?
Dividends rise cautiously in the base case from $3.045 to $3.18 and then $3.324 per share. The base dividends per share increase approximately 4.4% in 2028 and 4.5% in 2029. The bear freezes the annual dividend at $3.00, while the bull reaches $3.06, $3.24 and $3.4992 as earnings and recovery support the 50%–60% payout target.
Regulatory decisions are the first test. During 2026–2028, weaker Illinois reconciliation or Missouri rate-case outcomes would move earnings toward the bear case. Timely recovery of prudent investment would move them toward the bull case.
Funding will remain decisive across 2027–2029. Capital spending already exceeds operating cash, while Ameren expects substantial equity issuance. Higher issuance or lower prices would increase dilution. By 2028–2029, better operating cash from completed assets would reduce that pressure and support the bull case.
| October 2027 | October 2028 | October 2029 | |
|---|---|---|---|
| Earnings | 1,620 (1,556 / 1,635) | 1,760 (1,623 / 1,792) | 1,910 (1,693 / 1,964) |
| Shares (millions) | 292 (295 / 290) | 301 (311 / 297) | 308 (320 / 303) |
| Dividends per share | 3.04 (3.00 / 3.06) | 3.18 (3.00 / 3.24) | 3.32 (3.00 / 3.50) |
| Price to earnings | 18.30 (16.50 / 20.00) | 18.30 (15.50 / 21.00) | 18.30 (14.50 / 22.00) |
What this means. The price to earnings number shows how many dollars investors pay for each dollar the company earns.
What is Ameren’s dividend yield against its price?
The dividend does not remove that funding need. Ameren’s annualized dividend is $3.00 a share, about 56% of its $5.35 midpoint for 2026 earnings guidance. But free cash flow—the cash left after capital spending—is negative relative to the shares’ value. In 2025, operating cash was $3.353 billion against $4.128 billion of capital expenditure, so debt and new shares helped fund both investment and dividends. New shares raise money but divide future profits among more owners, making EPS growth more important than infrastructure growth alone.