Ameren stock forecast 2027–2029
MyStockButler's October 2026 analysis: Ameren’s weighted value is $99.80 in October 2027 and $108.98 in October 2029, with the bear case at 27%, the base case at 54%, and the bull case at 19%. It hinges on completed investment entering rate base, regulatory approval, connected and billed large-load demand, and controlled dilution.
Where could Ameren’s shares be in each forecast year?
Weighted value is $99.80 in October 2027, implying -3% including dividends. In October 2029, weighted value is $108.98, implying +11% including dividends. The bear case has 27% probability; the base case has 54%. The bull case has 19%.
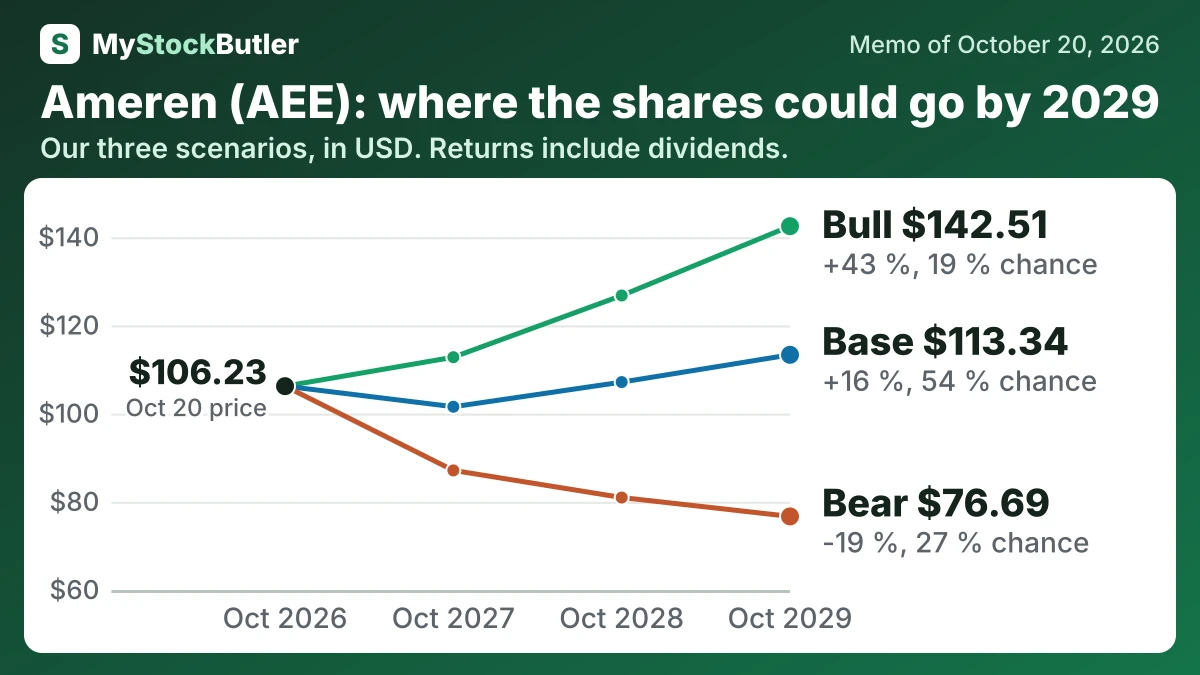
| Case | Probability | October 2027 | October 2028 | October 2029 |
|---|---|---|---|---|
| Bear | 27 % | 87.12 (-15 %) | 80.97 (-18 %) | 76.69 (-19 %) |
| Base | 54 % | 101.56 (-2 %) | 107.15 (+7 %) | 113.34 (+16 %) |
| Bull | 19 % | 112.80 (+9 %) | 126.79 (+25 %) | 142.51 (+43 %) |
| Weighted | 100 % | 99.80 (-3 %) | 103.81 (+4 %) | 108.98 (+11 %) |
What this means. The weighted row is a probability-based average of the three cases, not a promise that the shares will reach those prices.
What has to go right or wrong for Ameren?
The case turns on completed investment entering rate base, regulatory approval and signed large-load agreements becoming connected, billed demand. The Illinois Commerce Commission—the state agency that regulates utilities and approves their rates—is expected to decide Ameren’s proposed $2.75 billion 2028–2031 electric plan in December 2026. Ameren Missouri’s $343 million annual revenue increase is expected to be decided by May 2027. Sales under signed agreements are expected to start in the second half of 2027. Ameren expects $4 billion of equity funding through 2030, with heavier issuance in 2027 and 2028.
What matters in the table is the widening gap between a financing- and regulatory-constrained bear case and an execution-led bull case.
How much cash does Ameren really make?
Profit spreads the cost of an asset over its useful life, while cash flow records the construction payment when it occurs. Ameren generated $3,353 million of operating cash in 2025 and spent $4,174 million on capital projects. Free cash flow was therefore negative $821 million before dividends, or negative $849 million after stock compensation.
| 2025 | 2024 | 2023 | 2022 | 2021 | |
|---|---|---|---|---|---|
| Cash from operations | 3,353 | 2,763 | 2,564 | 2,263 | 1,661 |
| − Capital spending | 4,174 | 4,410 | 3,771 | 3,380 | 3,523 |
| = Free cash flow | -821 | -1,647 | -1,207 | -1,117 | -1,862 |
| − Stock pay | 28 | 28 | 26 | 24 | 22 |
| = Real free cash flow | -849 | -1,675 | -1,233 | -1,141 | -1,884 |
What this means. The capital spending here includes money spent on nuclear fuel as well as equipment and buildings, so it is broader than the usual meaning of capital spending.
What does an investor pay for Ameren today?
Ameren’s shares cost $106.23 on October 20, 2026, or 18.7 times its last twelve months’ earnings. P/E means the price investors pay for each dollar of annual profit, so this multiple is a direct test of what the business must deliver.
| Today (Oct 20, 2026) | |
|---|---|
| Share price | 106.23 |
| Market value (calculated) | 29,409.06 |
| Enterprise value (calculated) | 51,205.06 |
| P/E, last 12 months (calculated) | 18.7x |
| P/E, next 12 months (calculated) | 18.3x |