Evergy stock forecast 2027–2029
MyStockButler's October 2026 analysis: The weighted forecast puts the shares at $84.58 in October 2027. It hinges on customer demand ramping, regulatory recovery keeping pace and financing remaining manageable.
Where could Evergy's shares be by 2029?
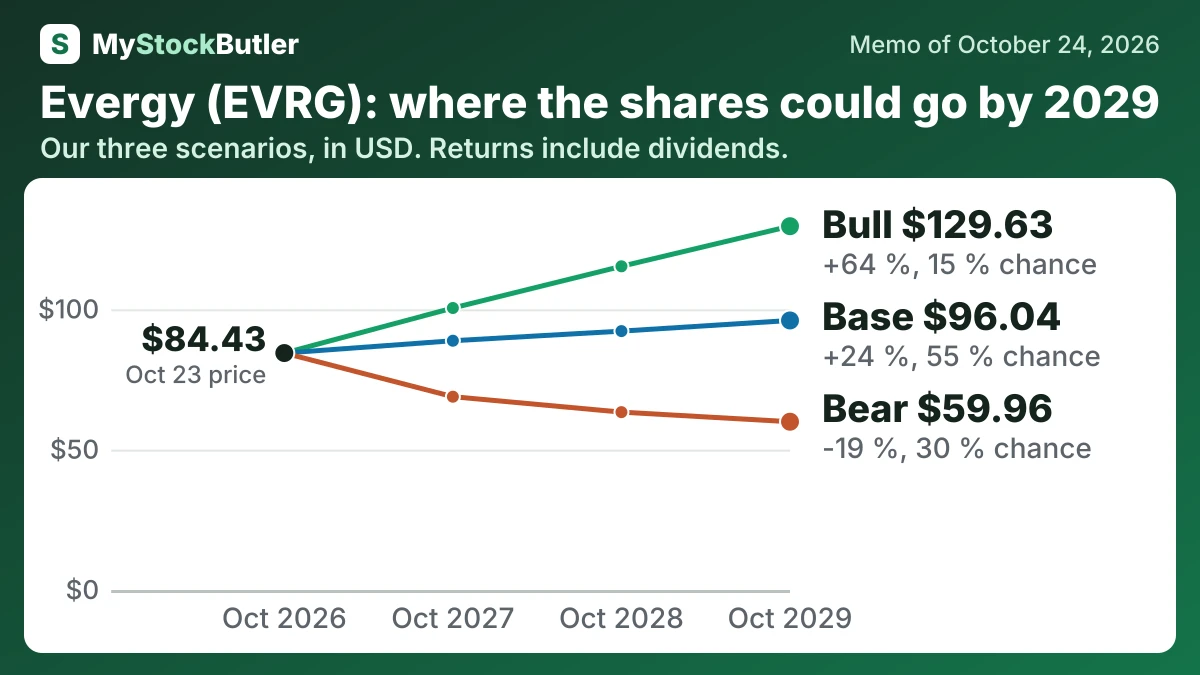
The weighted forecast puts the shares at $84.58 in October 2027. That implies a 4% total return including dividends. By October 2029, the weighted price is $90.25. The total return including dividends is 17%. The bear case has a 30% probability. The base case has 55%. The bull case has 15%.
| Case | Probability | October 2027 | October 2028 | October 2029 |
|---|---|---|---|---|
| Bear | 30 % | 68.87 (-15 %) | 63.37 (-18 %) | 59.96 (-19 %) |
| Base | 55 % | 88.82 (+9 %) | 92.25 (+16 %) | 96.04 (+24 %) |
| Bull | 15 % | 100.48 (+22 %) | 115.34 (+44 %) | 129.63 (+64 %) |
| Weighted | 100 % | 84.58 (+4 %) | 87.05 (+10 %) | 90.25 (+17 %) |
What this means. The weighted row is the average value based on the probabilities, not a separate possible outcome.
What has to go right for Evergy, and what could go wrong?
The bear case requires delayed large-customer projects, slower rate recovery, and higher financing costs. Construction continues, but earnings conversion lags; dilution and interest expense absorb more of the benefit. The price reaches $68.87 in October 2027 and $59.96 in October 2029. Its probability is 30% because the current multiple is elevated, free cash flow is negative, and equity issuance is substantial, although regulated earnings limit the risk of collapse.
The bull case requires customers to energize and ramp faster, completed projects to enter rates promptly, and financing costs to remain manageable. Stronger EPS growth supports both dividends and a premium valuation. The price reaches $100.48 in October 2027 and $129.63 in October 2029. Its probability is 15% because several execution steps must succeed together despite the capital programme and funding risks.
| October 2027 | October 2028 | October 2029 | |
|---|---|---|---|
| Earnings | 1,095 (1,008 / 1,140) | 1,207 (1,058 / 1,288) | 1,331 (1,111 / 1,455) |
| Shares (millions) | 253 (256 / 250) | 262 (267 / 257) | 270 (278 / 264) |
| Dividends per share | 2.81 (2.78 / 2.84) | 2.92 (2.78 / 3.00) | 3.04 (2.78 / 3.18) |
| Price to earnings | 20.50 (17.50 / 22.00) | 20.00 (16.00 / 23.00) | 19.50 (15.00 / 23.50) |
How much cash does Evergy really make?
In 2025, operating cash was $2.05 billion and capital spending was $2.80 billion. The result was negative free cash flow of $751.7 million. The deficit widened mainly because investment spending accelerated, not because cash collections collapsed.
| 2025 | 2024 | 2023 | 2022 | 2021 | |
|---|---|---|---|---|---|
| Cash from operations | 2,045.2 | 1,983.7 | 1,980.2 | 1,801.9 | 1,351.7 |
| − Capital spending | 2,796.9 | 2,336.6 | 2,334.0 | 2,166.5 | 1,972.5 |
| = Free cash flow | -751.7 | -352.9 | -353.8 | -364.6 | -620.8 |
| − Stock pay | 20.7 | 15.2 | 17.7 | 18.8 | 15.6 |
| = Real free cash flow | -772.4 | -368.1 | -371.5 | -383.4 | -636.4 |
What this means. The company brought in cash from daily business, but spent even more on equipment, so its free cash flow was negative; we also subtract shares given to employees because they reduce shareholders’ ownership.
What does an investor pay for Evergy today?
Evergy costs 21.4 times its last twelve months’ earnings and 18.5 times expected next-twelve-month earnings. The forward figure uses an estimate for a different period from management’s 2026 adjusted EPS guidance of $4.14–$4.34, so the two figures are not automatically comparable.