Alliant Energy stock forecast 2027–2029
MyStockButler's October 2026 analysis: The probability-weighted path is $64.17 for October 2027, $66.65 for October 2028, and $69.72 for October 2029. It hinges on customer ramp, project budgets and schedules, regulatory recovery, financing and new share issuance.
Where could Alliant Energy’s shares be by 2029?
Our probability-weighted share price is $64.17 for October 2027, a 6% loss including dividends. It is $69.72 for October 2029, a 9% gain. The bear case has a 30% probability. The base and bull cases have 50% and 20%, respectively.
The central forecast is a muted near-term result followed by gradual recovery. The probability-weighted price for October 2027 is $64.17, a 6% loss including dividends. For October 2028, it is $66.65, a 1% gain including dividends. For October 2029, it is $69.72, a 9% gain including dividends.
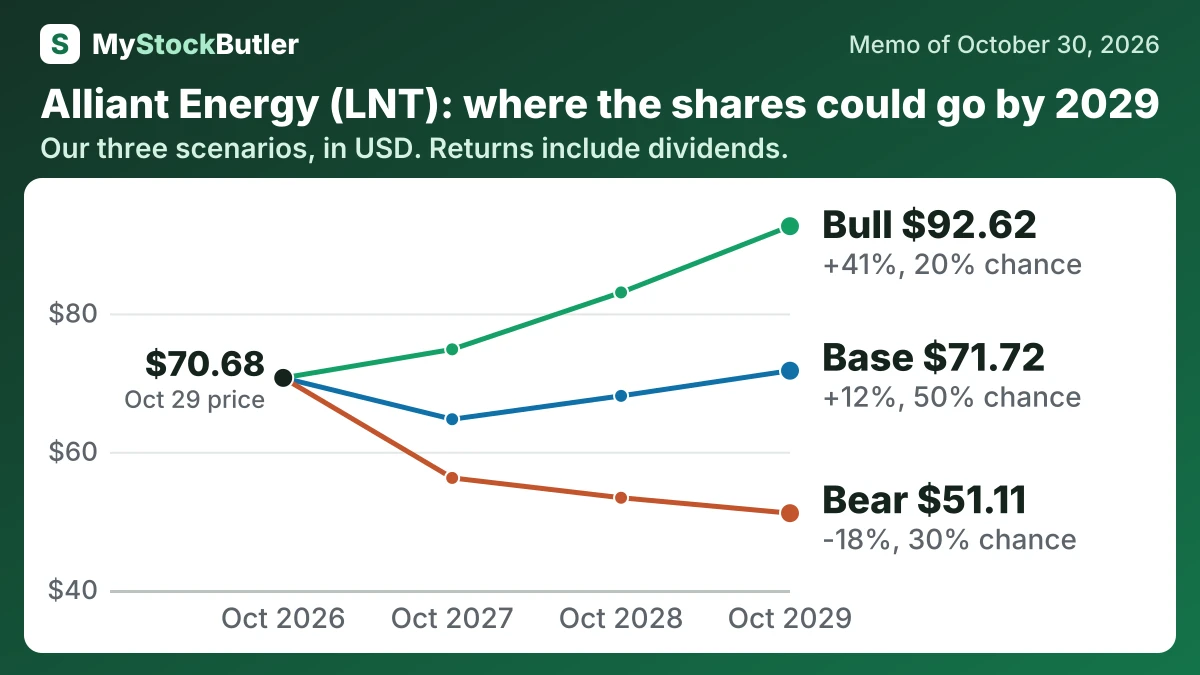
| Case | Probability | October 2027 | October 2028 | October 2029 |
|---|---|---|---|---|
| Bear | 30% | 56.21 (-17%) | 53.34 (-18%) | 51.11 (-18%) |
| Base | 50% | 64.70 (-5%) | 68.08 (+3%) | 71.72 (+12%) |
| Bull | 20% | 74.81 (+9%) | 83.04 (+24%) | 92.62 (+41%) |
| Weighted | 100% | 64.17 (-6%) | 66.65 (+1%) | 69.72 (+9%) |
What this means. The weighted value is the probability-based average of all three cases, not the value you should expect from the base case alone.
What has to go right or wrong for Alliant Energy?
The base earnings row starts at $949 million in October 2027. It rises to $1,044 million in October 2028 and reaches $1,141 million in October 2029. The path reflects a rolling transition from 2026 guidance to 2027 guidance, followed by roughly 10% annual growth. Management’s current ongoing EPS guidance is $3.41–$3.46 for 2026 and $3.63–$3.73 for 2027. The bear case gives $900 million, $940 million and $980 million because delayed demand, cost pressure and financing offset rate-base growth. The bull case gives $990 million, $1,100 million and $1,220 million because contracted loads and projects arrive on schedule. Alliant’s record of meeting or exceeding its initial earnings range in all five reviewed years supports the base, but not certainty.
| October 2027 | October 2028 | October 2029 | |
|---|---|---|---|
| Earnings | 949 (900 / 990) | 1,044 (940 / 1,100) | 1,141 (980 / 1,220) |
| Shares (millions) | 279 (280 / 278) | 288 (291 / 285) | 294 (297 / 290) |
| Dividends per share | 2.25 (2.25 / 2.25) | 2.36 (2.25 / 2.39) | 2.48 (2.25 / 2.54) |
| Price to earnings | 19.00 (17.50 / 21.00) | 18.80 (16.50 / 21.50) | 18.50 (15.50 / 22.00) |
What this means. The price to earnings number shows how many dollars investors pay for each dollar of the company's yearly profit, so a higher number means a more expensive valuation.
How much cash does Alliant Energy really make?
In 2025, net income was $810 million and operating cash was $1.169 billion. The difference reflects non-cash items such as depreciation and deferred taxes, as well as the timing of customer collections and supplier payments. Capital spending was $2.483 billion, producing free cash flow of negative $1.314 billion.
A second measure subtracts stock pay from free cash flow because issuing shares or stock compensation imposes an economic cost on existing owners. That measure was negative $1.336 billion in 2025. Negative free cash flow is not automatically a failure for a utility building assets meant to serve customers for decades, but the gap must be financed.
| 2025 | 2024 | 2023 | 2022 | 2021 | |
|---|---|---|---|---|---|
| Cash from operations | 1,169 | 1,167 | 867 | 486 | 582 |
| − Capital spending | 2,483 | 2,249 | 1,854 | 1,484 | 1,169 |
| = Free cash flow | -1,314 | -1,082 | -987 | -998 | -587 |
| − Stock pay | 22 | 12 | 12 | 13 | 14 |
| = Real free cash flow | -1,336 | -1,094 | -999 | -1,011 | -601 |
What this means. Stock pay is subtracted even though it uses no cash because giving shares to employees reduces the part of the company owned by existing shareholders.