Chevron vs ConocoPhillips stock: the numbers side by side (October 2026)
How do Chevron and ConocoPhillips compare?
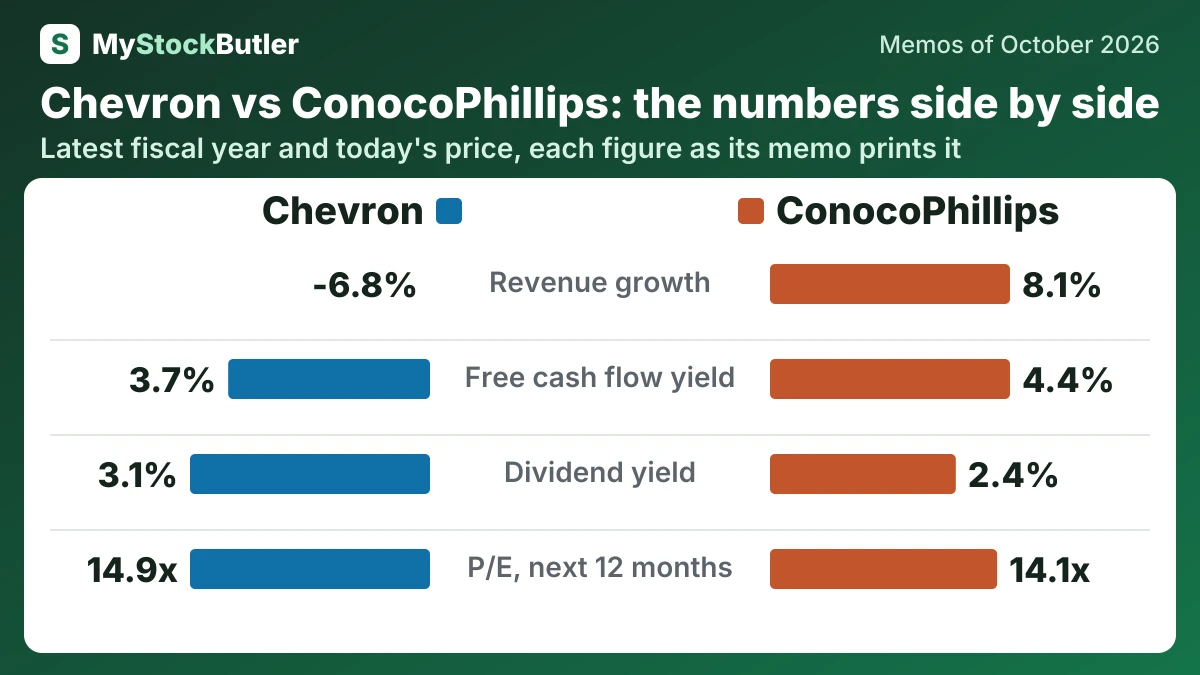
| Chevron CVX | ConocoPhillips COP | |
|---|---|---|
| Revenue growth | -6.8%2025 | 8.1%2025 |
| Free cash flow | 16,592US$ millions · 2025 | 7,243US$ millions · 2025 |
| Free cash flow yield | 3.7%Today (Oct 30, 2026) | 4.4%Today (Oct 13, 2026) |
| Dividend yield | 3.1%Today (Oct 30, 2026) | 2.4%Today (Oct 13, 2026) |
| P/E, last 12 months | 16.9xToday (Oct 30, 2026) | 18.2xToday (Oct 13, 2026) |
| P/E, next 12 months | 14.9xToday (Oct 30, 2026) | 14.1xToday (Oct 13, 2026) |
| Weighted price forecast, about 1 year | 232.23 (+3 %)October 2027 | 145.55 (+8 %)October 2027 |
| Weighted price forecast, about 3 years | 257.81 (+21 %)October 2029 | 183.15 (+40 %)October 2029 |
Who leads on what?
| Leads | The lead is | |
|---|---|---|
| Revenue growth | ConocoPhillips | The higher figure |
| Free cash flow | Chevron | The higher figure |
| Free cash flow yield | ConocoPhillips | The higher figure |
| Dividend yield | Chevron | The higher figure |
| P/E, last 12 months | Chevron | The lower figure |
| P/E, next 12 months | ConocoPhillips | The lower figure |
| Weighted price forecast, about 1 year | ConocoPhillips | The higher weighted return |
| Weighted price forecast, about 3 years | ConocoPhillips | The higher weighted return |
What does each company do?
Chevron sells crude oil and natural gas to refiners, utilities, industrial buyers and traders.
Chevron (CVX), from our memo of October 30, 2026 · Chevron stock forecast
ConocoPhillips (COP) explores for and produces crude oil, bitumen, natural gas, natural gas liquids (NGLs) such as ethane and propane, and liquefied natural gas (LNG), which is natural gas cooled into liquid form for shipment by sea.
ConocoPhillips (COP), from our memo of October 13, 2026 · ConocoPhillips stock forecast
How big are Chevron and ConocoPhillips?
At Chevron, revenue came to US$67,798 million in the quarter to September 2026; at ConocoPhillips, it came to US$19,522 million in the quarter to June 2026.
How fast are Chevron and ConocoPhillips growing, and what did their latest results show?
Revenue at Chevron fell 6.8% in 2025, and revenue at ConocoPhillips grew 8.1% in 2025.
Revenue was $67.798 billion in the quarter. Net income was $9.924 billion. Diluted EPS was $5.06. Average realized liquids price was $72.29 a barrel. U.S. downstream earnings reached $3.585 billion as refined-product margins strengthened and refineries ran reliably.
Chevron (CVX), from our memo of October 30, 2026 · Chevron earnings
Revenue rose from $14,740 million to $19,522 million. Net income nearly doubled, even though production fell from 2,391 to 2,248 thousand BOE a day. This is the clearest recent reminder that a producer can earn more while extracting less.
ConocoPhillips (COP), from our memo of October 13, 2026 · ConocoPhillips earnings
How much cash do Chevron and ConocoPhillips generate, and where does it go?
Chevron’s free cash flow was US$16,592 million in 2025; ConocoPhillips’ was US$7,243 million in 2025. At Chevron, the dividend yield was 3.1% on October 30, 2026; at ConocoPhillips, it was 2.4% on October 13, 2026.
Chevron spent $17.347 billion on capital projects in 2025. Free cash flow was $16.592 billion. It was $37.628 billion in 2022, when prices were stronger. Chevron paid $12.751 billion in common dividends in 2025, leaving less cash before buybacks, debt movements and other investments.
Chevron (CVX), from our memo of October 30, 2026 · Chevron stock forecast
Capital spending was $12,553 million, leaving $7,243 million of free cash flow on the cash-statement basis. After stock compensation of $336 million, analytical “real free cash flow” was $6,907 million. Stock awards usually require no immediate cash, but they transfer ownership to employees, so they are an economic cost to shareholders.
ConocoPhillips (COP), from our memo of October 13, 2026 · ConocoPhillips stock forecast
What does an investor pay for Chevron and ConocoPhillips today?
Chevron traded at 16.9x the last 12 months’ earnings and 14.9x the next 12 months’ on October 30, 2026; ConocoPhillips traded at 18.2x the last 12 months’ earnings and 14.1x the next 12 months’ on October 13, 2026. Chevron’s free cash flow yield was 3.7% on October 30, 2026; ConocoPhillips’ was 4.4% on October 13, 2026.
At $231.46 a share, Chevron represents a large claim on an energy business whose cash returns depend heavily on oil prices.
Chevron (CVX), from our memo of October 30, 2026 · Chevron dividend
The price-to-earnings ratio, or P/E, says how much investors pay for each dollar of profit. COP’s lower forward P/E already assumes analysts’ expected earnings improvement. Free cash flow is different from cash from operations because it subtracts the capital needed to maintain and expand production. COP’s promise to return 45% of cash from operations therefore still needs testing against sustaining investment, especially in a downturn.
ConocoPhillips (COP), from our memo of October 13, 2026 · ConocoPhillips stock forecast