Apple vs Intel stock: the numbers side by side (October 2026)
How do Apple and Intel compare?
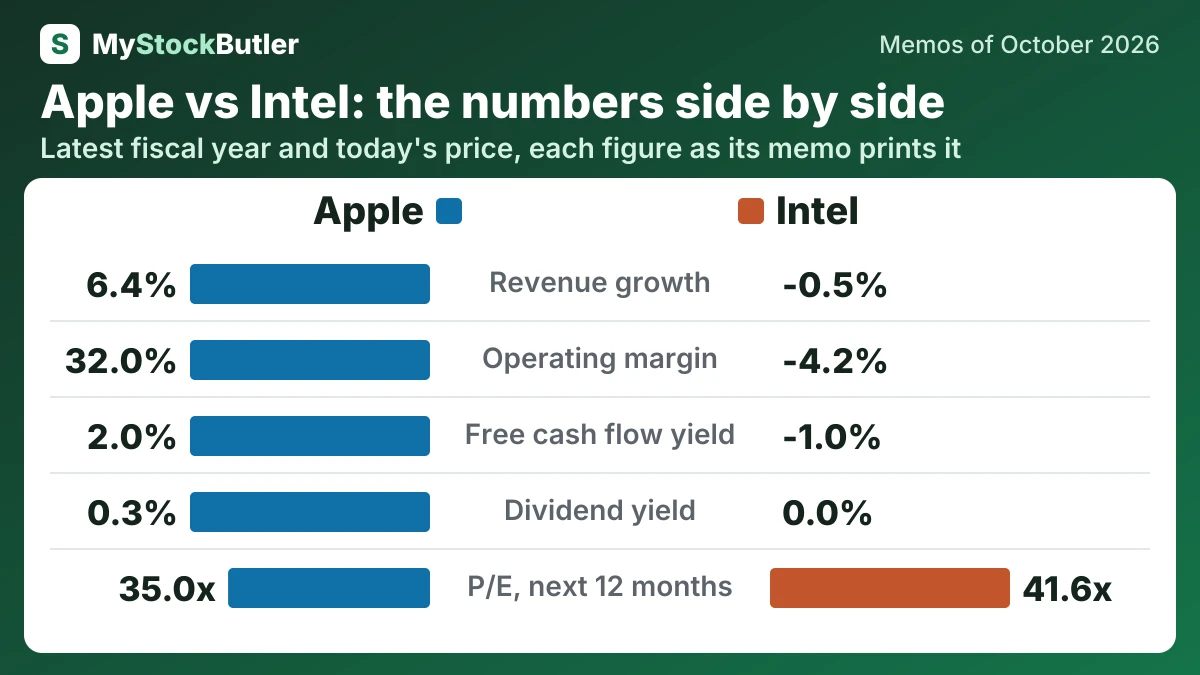
| Apple AAPL | Intel INTC | |
|---|---|---|
| Revenue growth | 6.4%Sep 2025 | -0.5%2025 |
| Operating margin | 32.0%Sep 2025 | -4.2%2025 |
| Free cash flow | 98,767US$ millions · Sep 2025 | -4,949US$ millions · 2025 |
| Free cash flow yield | 2.0%Today (Oct 11, 2026) | -1.0%Today (Oct 29, 2026) |
| Dividend yield | 0.3%Today (Oct 11, 2026) | 0.0%Today (Oct 29, 2026) |
| P/E, last 12 months | 38.6xToday (Oct 11, 2026) | not meaningfulToday (Oct 29, 2026) |
| P/E, next 12 months | 35.0xToday (Oct 11, 2026) | 41.6xToday (Oct 29, 2026) |
| Weighted price forecast, about 1 year | 315.27 (-6 %)October 2027 | 91.05 (-1 %)October 2027 |
| Weighted price forecast, about 3 years | 313.03 (-6 %)October 2029 | 90.33 (-2 %)October 2029 |
Who leads on what?
| Leads | The lead is | |
|---|---|---|
| Revenue growth | Apple | The higher figure |
| Operating margin | Apple | The higher figure |
| Free cash flow | Apple | The higher figure |
| Free cash flow yield | Apple | The higher figure |
| Dividend yield | Apple | The higher figure |
| P/E, last 12 months | — | The lower figure |
| P/E, next 12 months | Apple | The lower figure |
| Weighted price forecast, about 1 year | Intel | The higher weighted return |
| Weighted price forecast, about 3 years | Intel | The higher weighted return |
What does each company do?
Apple sells iPhones, Macs, iPads, wearables and services to consumers and organizations.
Apple (AAPL), from our memo of October 11, 2026 · Apple stock forecast
Intel designs and sells processors—the main chips that carry out computer instructions—for PC makers, cloud providers, enterprises, and automakers.
Intel (INTC), from our memo of October 29, 2026 · Intel stock forecast
How big are Apple and Intel?
At Apple, revenue came to US$109,417 million in the quarter to June 2026; at Intel, it came to US$16,513 million in the quarter to September 2026.
How fast are Apple and Intel growing, and what did their latest results show?
Apple’s revenue grew 6.4% in the year to September 2025; Intel’s fell 0.5% in 2025.
For the quarter ended June 27, 2026, revenue reached $109,417 million, up about 16.4%. Growth was broad: iPhone, Mac, Services and Wearables, Home and Accessories increased, while iPad declined. Pro iPhones and Mac laptops helped drive the result, and Services continued to benefit from advertising and cloud spending.
Apple (AAPL), from our memo of October 11, 2026 · Apple earnings
Operating performance improved across the quarter’s main measures. Gross margin, operating income and cash generation all moved in the right direction, as the quarterly table shows. That combination matters more than a single sales increase because it suggests better product mix, factory execution or cost absorption.
Intel (INTC), from our memo of October 29, 2026 · Intel earnings
How much cash do Apple and Intel generate, and where does it go?
Apple’s free cash flow was US$98,767 million in the year to September 2025; Intel’s was −US$4,949 million in 2025. At Apple, the dividend yield was 0.3% on October 11, 2026; at Intel, it was 0.0% on October 29, 2026.
Free cash flow is cash from operations after spending on long-term assets. Apple generated $111,482 million from operations in 2025. After capital spending, free cash flow was $98,767 million, or 23.7% of revenue. That was below the prior year despite higher earnings, so one year’s cash conversion needs explanation.
Apple (AAPL), from our memo of October 11, 2026 · Apple stock forecast
A stricter calculation subtracts stock pay as an economic cost. On that basis, 2025 real free cash flow was negative $7.4 billion. Intel’s own adjusted free cash flow was negative $1.6 billion because it includes items such as government incentives and factory-partner contributions. Those sources help fund construction, but they can carry ownership or future-distribution claims. Cash generation is therefore the bridge between better products and a financeable factory plan.
Intel (INTC), from our memo of October 29, 2026 · Intel stock forecast
What does an investor pay for Apple and Intel today?
The shares of Apple were priced at 35.0x the next 12 months’ earnings on October 11, 2026; those of Intel at 41.6x the next 12 months’ earnings on October 29, 2026. Apple’s free cash flow yield was 2.0% on October 11, 2026; Intel’s was -1.0% on October 29, 2026.
At the October 29, 2026 close, one Intel share cost $92.07, valuing all the company’s shares at about $488.9 billion. Enterprise value is a rough price for the operating business: shareholder value plus financing claims, minus cash. Intel’s enterprise value was $485.0 billion.
Intel (INTC), from our memo of October 29, 2026 · Intel stock forecast