Xylem stock forecast 2027–2029
MyStockButler's October 2026 analysis: Xylem's probability-weighted price is $89.01 in October 2027 and $118.94 in October 2029, with a soft first year followed by recovery. It hinges on orders becoming durable earnings and cash.
Where could Xylem's shares go?
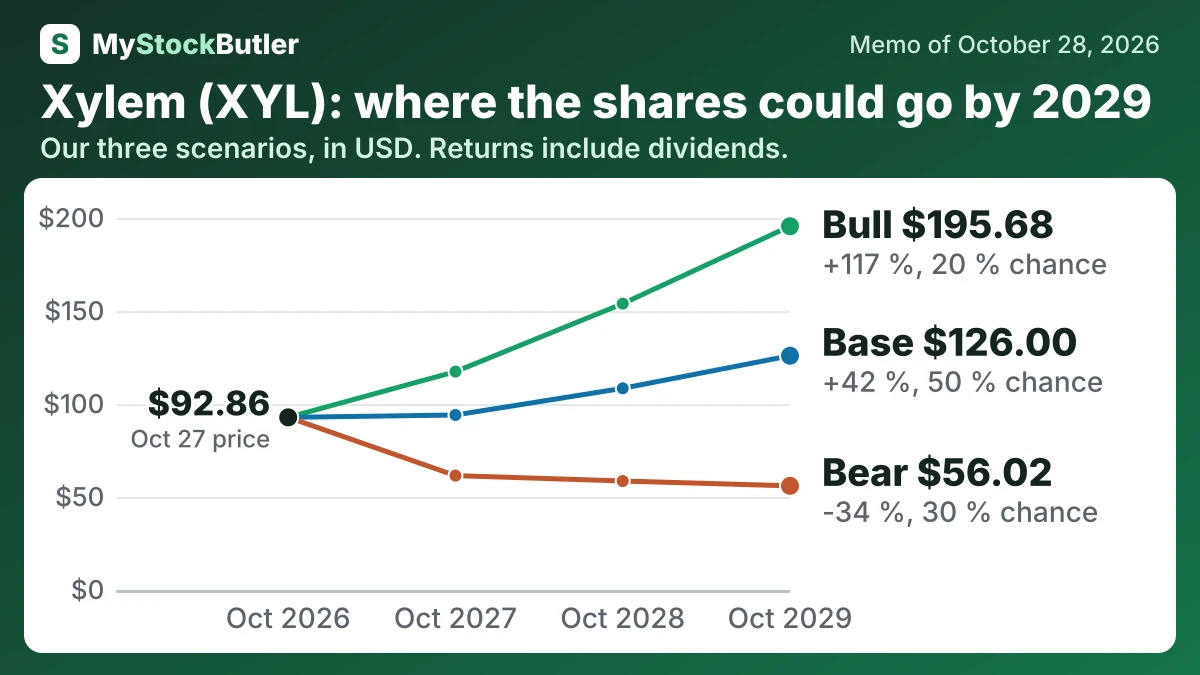
The probability-weighted price is $89.01 in October 2027, a 2% loss with dividends. It rises to $102.64 in October 2028, a 14% gain. By October 2029, it reaches $118.94, a 34% gain.
The bear path receives 30%. The base path receives 50%. The bull path receives 20%, because gradual conversion has stronger evidence than either prolonged weakness or a rapid acceleration.
| Case | Probability | October 2027 | October 2028 | October 2029 |
|---|---|---|---|---|
| Bear | 30 % | 61.52 (-32 %) | 58.61 (-33 %) | 56.02 (-34 %) |
| Base | 50 % | 94.13 (+3 %) | 108.49 (+21 %) | 126.00 (+42 %) |
| Bull | 20 % | 117.47 (+28 %) | 154.03 (+70 %) | 195.68 (+117 %) |
| Weighted | 100 % | 89.01 (-2 %) | 102.64 (+14 %) | 118.94 (+34 %) |
What this means. The weighted row is the average expected share price after giving each case its stated probability.
What has to go right or wrong for Xylem?
This starts above the subdued 2026 outlook of $8.95 billion revenue and flat organic growth. It is supported by a backlog of about $5.5 billion and by the expectation that projects convert gradually. The bear case keeps revenue near $9.0 billion, $9.1 billion and $9.3 billion, with margins of 12.0%, 12.2% and 12.4%. The bull case reaches $9.7 billion, $10.6 billion and $11.6 billion, with margins of 14.2%, 15.0% and 15.5%. Data-center orders rising more than 200% year over year support the upside, while delayed utility spending supports the downside.
How much cash does Xylem really make?
The table’s “real free cash flow” subtracts stock pay, leaving $857 million in 2025. That is an economic cost because stock compensation can dilute shareholders, although it is not a second cash payment in the same year. Free cash flow also comes before acquisitions, debt repayment and dividends.
| 2025 | 2024 | 2023 | 2022 | 2021 | |
|---|---|---|---|---|---|
| Cash from operations | 1,241 | 1,263 | 837 | 596 | 538 |
| − Capital spending | 331 | 321 | 271 | 208 | 208 |
| = Free cash flow | 910 | 942 | 566 | 388 | 330 |
| − Stock pay | 53 | 56 | 60 | 37 | 33 |
| = Real free cash flow | 857 | 886 | 506 | 351 | 297 |
What this means. The money tied up in working capital is already included in cash from operations, so do not subtract it again.
What does an investor pay for Xylem today?
The forward multiple implies approximately $6.07 of earnings per share. Xylem’s new 2026 adjusted earnings guidance is $5.40–$5.45 per share. Its midpoint is $5.425, so the implied figure is about 12% higher. A consensus estimate available on October 28, 2026, puts next year’s earnings at $6.18 per share, with expected growth of 9.38%.
| Today (Oct 28, 2026) | |
|---|---|
| Share price | 92.86 |
| Enterprise value (calculated) | 23,483.01 |
| P/E, next 12 months (calculated) | 15.3x |
| Free cash flow yield (calculated) | 4.3% |
| Real free cash flow yield (calculated) | 4.0% |
What this means. The next twelve months price-to-earnings ratio uses analysts’ guesses about future profit, so it is not guaranteed.