West stock forecast 2027–2029
MyStockButler's October 2026 analysis: West's weighted forecast reaches $406.00 in October 2027; the base case carries 55% probability. It hinges on sustained HVP growth and stronger utilization.
Where could West's shares be by 2029?
It reaches $426.22 in October 2028, a 9% total return. By October 2029, it reaches $451.57, a 16% total return. The last-date bear-to-bull range is $250.08 to $679.99. The base case receives 55% probability, against 25% for bear and 20% for bull.
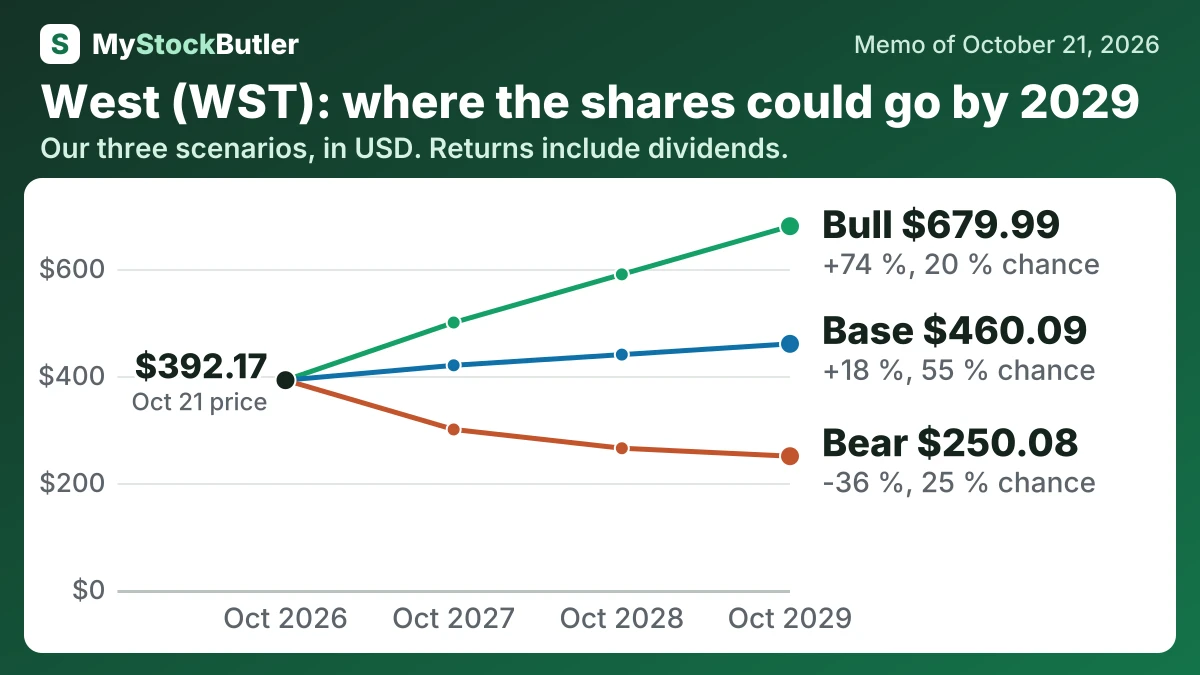
| Case | Probability | October 2027 | October 2028 | October 2029 |
|---|---|---|---|---|
| Bear | 25 % | 300.04 (-23 %) | 264.94 (-32 %) | 250.08 (-36 %) |
| Base | 55 % | 419.99 (+7 %) | 439.99 (+13 %) | 460.09 (+18 %) |
| Bull | 20 % | 499.95 (+28 %) | 589.95 (+51 %) | 679.99 (+74 %) |
| Weighted | 100 % | 406.00 (+4 %) | 426.22 (+9 %) | 451.57 (+16 %) |
What must go right for West, and what could go wrong?
The base assumes revenue of $3,699 million initially and $3,976 million one year later. It reaches $4,274 million by 2029, with margins settling near 19%. The bear assumes roughly 3% annual revenue growth and margins falling from 16.5% to 15.5%. The bull assumes growth of about 12% initially and margins rising from 19.2% to 20.5%.
The base reflects H1 net income of $292.8 million, Q2 HVP organic growth of 18.4%, and the supplied next-twelve-month EPS estimate of $10.02573. The bear reflects destocking, customer concentration and underused capacity. The bull requires broader HVP and GLP-1 demand plus stronger utilization.
How much cash does West really make?
Across 2021–2025, cumulative free cash flow was approximately $1.93 billion, or approximately $1.80 billion after stock pay. Management’s 2026 plan described roughly 40% of capital spending as maintenance and 60% as growth investment, but that is a forecast rather than an audited historical split. The table follows operating cash, working capital, capital spending, free cash flow and the stock-pay adjustment.
| 2025 | 2024 | 2023 | 2022 | 2021 | |
|---|---|---|---|---|---|
| Cash from operations | 754.8 | 653.4 | 776.5 | 724.0 | 584.0 |
| − Capital spending | 285.9 | 377.0 | 362.0 | 284.6 | 253.4 |
| = Free cash flow | 468.9 | 276.4 | 414.5 | 439.4 | 330.6 |
| − Stock pay | 23.8 | 18.7 | 23.3 | 23.7 | 37.5 |
| = Real free cash flow | 445.1 | 257.7 | 391.2 | 415.7 | 293.1 |
| Real free cash flow, % of revenue | 14.5% | 8.9% | 13.3% | 14.4% | 10.4% |
What this means. Real free cash flow is lower because paying employees with shares uses no cash today but gives away part of the company.
What does an investor pay for West today?
The forward P/E is lower because earnings are expected to rise, not because the shares became cheaper. West traded at 50.2 times trailing earnings and 39.1 times expected earnings on October 21, 2026, implying roughly 28% earnings growth if the measures use the same accounting basis. That comparison fails if trailing profit is GAAP while forecast profit is adjusted: in the second quarter of 2026, West reported diluted EPS of $2.15 and adjusted EPS of $2.37.
| Today (Oct 21, 2026) | |
|---|---|
| Share price | 392.165 |
| Market value (calculated) | 27,598.9 |
| Enterprise value (calculated) | 27,370.4 |
| P/E, last 12 months (calculated) | 50.2x |
| P/E, next 12 months (calculated) | 39.1x |
| Free cash flow yield (calculated) | 1.7% |
What this means. The price-to-earnings ratio for the next 12 months uses analysts’ predicted profit, so it may be wrong if the company earns more or less than expected.