Williams-Sonoma stock forecast 2027–2029
MyStockButler's October 2026 analysis: The weighted forecast points to a 4% loss with dividends by October 2029. It hinges on whether Williams-Sonoma can convert proprietary products into full-price, cash-generating growth after tariff relief ends.
Where could Williams-Sonoma's shares be by October 2029?
The weighted forecast points to a 4% loss with dividends by October 2029, hinging on ordinary sales, margins and cash generation holding after tariff benefits fade.
The weighted price is $237.43 in October 2027, a 5% loss with dividends. It is $233.46 in October 2029, a 4% loss with dividends. Bear carries 25% probability. Base carries 55%. Bull carries 20%. By October 2029, the bear case is $130.10, the base case is $246.71 and the bull case is $326.20.
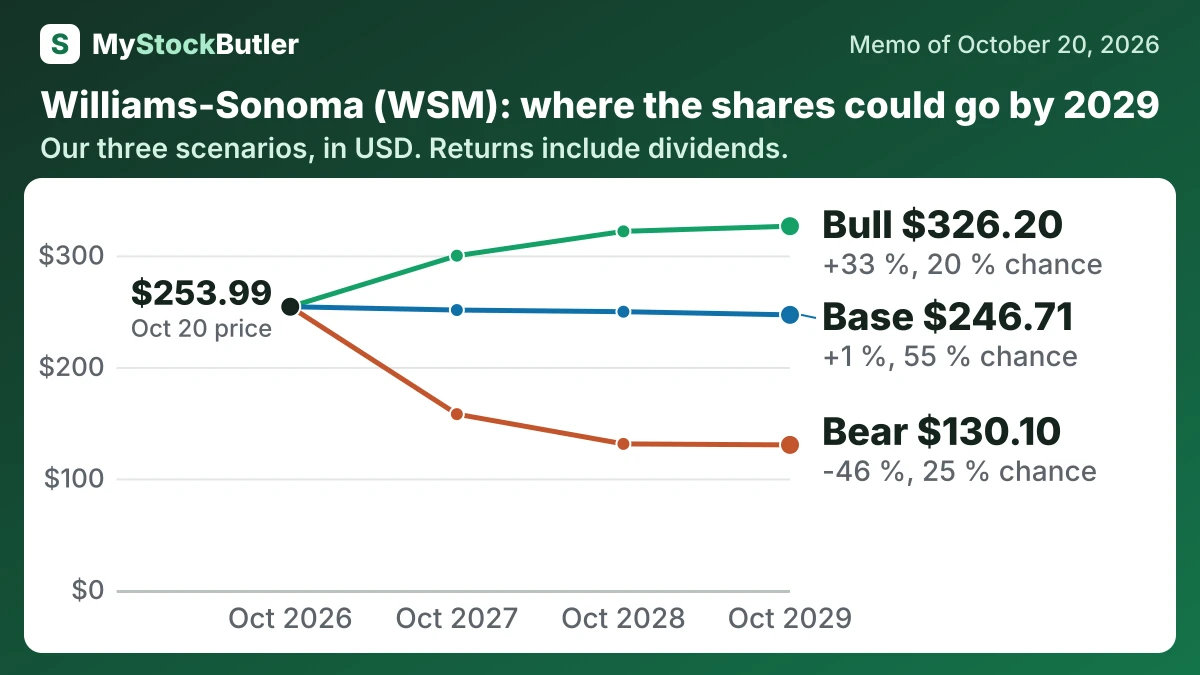
| Case | Probability | October 2027 | October 2028 | October 2029 |
|---|---|---|---|---|
| Bear | 25 % | 157.68 (-37 %) | 130.99 (-46 %) | 130.10 (-46 %) |
| Base | 55 % | 251.01 (+0 %) | 249.53 (+1 %) | 246.71 (+1 %) |
| Bull | 20 % | 299.74 (+19 %) | 321.58 (+29 %) | 326.20 (+33 %) |
| Weighted | 100 % | 237.43 (-5 %) | 234.31 (-5 %) | 233.46 (-4 %) |
What this means. The weighted value is the probability-based average of the three cases, so it can be below today's price even though the bull case is higher.
What has to go right for Williams-Sonoma, and what could go wrong?
The next results are estimated for November 18, 2026, not company-confirmed. Sales against guidance, ordinary merchandise margins and inventory growth against demand will decide the next move. WSM expects $29.3 million of deferred tariff-refund income to reduce Q3 cost of goods sold. Sustained full-price selling, delivery efficiencies, housing demand and profitable B2B and newer-brand growth support the bull case; weaker cash generation or reduced buybacks support the bear case.
| October 2027 | October 2028 | October 2029 | |
|---|---|---|---|
| Normal operating profit | 1,479 (1,240 / 1,530) | 1,531 (1,170 / 1,620) | 1,584 (1,240 / 1,702) |
| Shares (millions) | 116 (117 / 115) | 114 (116 / 113) | 112 (114 / 111) |
| Dividends per share | 3.20 (3.04 / 3.36) | 3.52 (2.64 / 3.86) | 3.87 (2.64 / 4.44) |
| Enterprise value to normal operating profit | 19.00 (14.00 / 22.00) | 18.00 (12.00 / 22.00) | 17.00 (11.00 / 21.00) |
| Net debt | -997 (-1,083 / -845) | -923 (-1,135 / -630) | -806 (-1,243 / -370) |
What this means. Negative net debt means the company has more cash than borrowed money.
How much cash does Williams-Sonoma really make?
The turn is modest: fiscal 2025 revenue growth recovered to 1.2%, while operating margin was 18.1%. Real free cash flow, calculated here as free cash flow less stock compensation, was 12.2% of revenue, and net cash was $1,019,801 thousand. Dividends and buybacks exceeded free cash flow by $0.93 per share as diluted shares fell 3.8%.
| Feb 2026 | Feb 2025 | Jan 2024 | Jan 2023 | Jan 2022 | |
|---|---|---|---|---|---|
| Cash from operations | 1,314,889 | 1,360,222 | 1,680,273 | 1,052,822 | 1,371,147 |
| − Capital spending | 259,438 | 221,567 | 188,458 | 354,117 | 226,517 |
| = Free cash flow | 1,055,451 | 1,138,655 | 1,491,815 | 698,705 | 1,144,630 |
| − Stock pay | 106,522 | 98,983 | 84,754 | 90,268 | 95,240 |
| = Real free cash flow | 948,929 | 1,039,672 | 1,407,061 | 608,437 | 1,049,390 |
| Real free cash flow, % of revenue | 12.2% | 13.5% | 18.2% | 7.0% | 12.7% |
What this means. Real free cash flow is lower because paying employees with shares uses no cash but gives them part of the company.
What does an investor pay today for Williams-Sonoma's earnings and cash?
The price-to-earnings ratio, or P/E, says how much investors pay for each dollar of profit. A forward P/E uses estimated future earnings, while a trailing P/E uses reported earnings. A displayed 0.0x trailing P/E is therefore a data problem or mismatched denominator, not evidence that the company is free. The forward multiple still asks investors to trust earnings that have not yet arrived.