Williams-Sonoma earnings date
MyStockButler's October 2026 analysis: Williams-Sonoma's next results are expected on November 18, 2026. The key watch is ordinary merchandise margin after tariff pressure eases.
What has Williams-Sonoma guided for the year?
Management’s promise is faster sales growth while preserving a high operating margin, even with tariffs still affecting the business.
On August 26, 2026, management raised its full-year sales-growth, comparable-sales and operating-margin outlook. A comparable sale, or comp, measures the established stores and websites against their own earlier performance. If WSM opens another Pottery Barn, total sales can rise without older locations selling more; a comp shows whether the existing business is winning more demand. That makes comps a cleaner test of the core business.
| The period guided | Low | High | The date it was given | |
|---|---|---|---|---|
| Annual net revenues (growth) | Fiscal 2026 | 4.7% | 7.2% | Aug 26, 2026 |
| Comps | Fiscal 2026 | 4.0% | 6.5% | Aug 26, 2026 |
| Operating margin, on a non-GAAP basis | Fiscal 2026 | 17.8% | 18.2% | Aug 26, 2026 |
| Annual interest income, on a non-GAAP basis (US$ millions) | Fiscal 2026 | 25 | 25 | Aug 26, 2026 |
| Effective tax rate, on a non-GAAP basis | Fiscal 2026 | 26.0% | 26.0% | Aug 26, 2026 |
Has Williams-Sonoma kept its past promises?
Williams-Sonoma also beat its original fiscal 2025 forecast. Management expected comparable revenue growth of flat to 3.0% and an operating margin of 17.4%–17.8%. It delivered 3.5% comparable growth and an 18.1% operating margin. Operating margin is the share of sales left after operating costs. This is a clearer accountability test than relying only on a rising share price.
| What management forecast | Checked | Above | Within | Below |
|---|---|---|---|---|
| Annual net revenue growth | 5 years | 1 | 3 | 1 |
| Operating margin | 4 years | 3 | 1 | 0 |
What is Williams-Sonoma's trend over the last eight quarters?
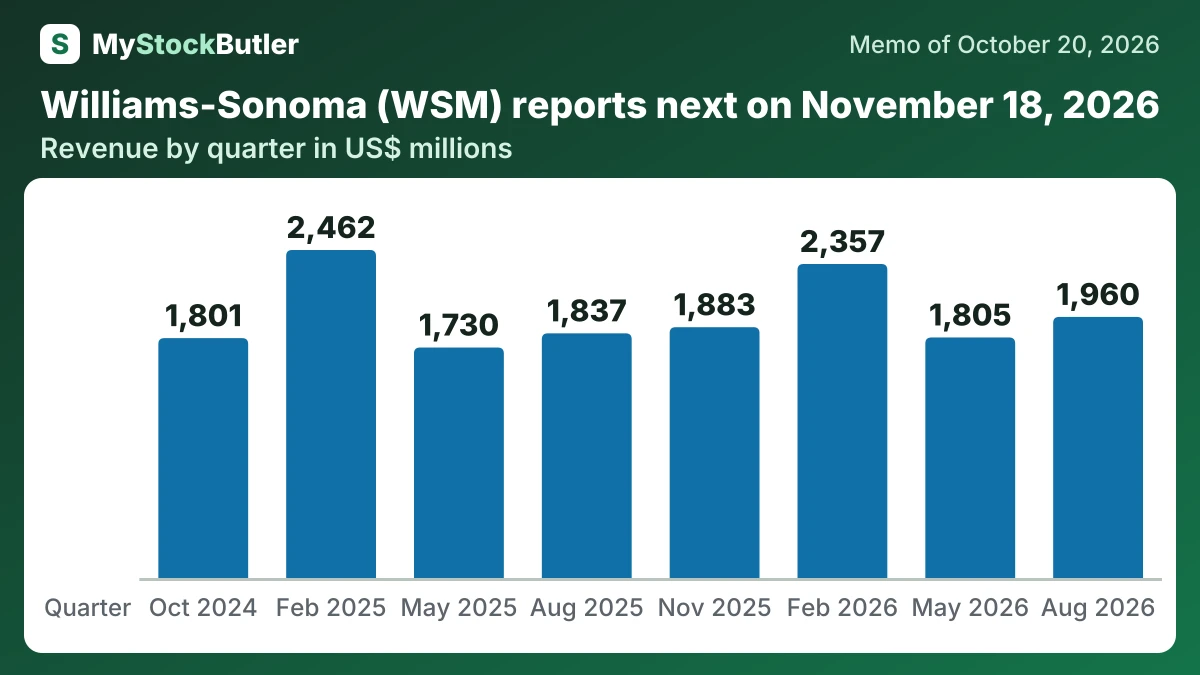
Revenue rose sharply during the earlier boom, then fell for two years before returning to growth in fiscal 2025. The business is recovering within an established base, not setting a new sales record. The results table shows that pattern across revenue, margins, profit and dividends.
| Aug 2026 | May 2026 | Feb 2026 | Nov 2025 | Aug 2025 | May 2025 | Feb 2025 | Oct 2024 | |
|---|---|---|---|---|---|---|---|---|
| Revenue | 1,959,757 | 1,805,456 | 2,357,129 | 1,882,814 | 1,836,760 | 1,730,113 | 2,462,218 | 1,800,668 |
| Gross margin | 51.6% | 43.9% | 46.9% | 46.1% | 47.1% | 44.3% | 47.3% | 45.4% |
| Operating income | 448,795 | 291,688 | 477,807 | 319,143 | 328,059 | 290,713 | 530,141 | 305,031 |
| Net income | 338,109 | 231,362 | 368,020 | 241,592 | 247,562 | 231,263 | 410,718 | 237,262 |
| EPS, diluted (US$ per share) | 2.84 | 1.93 | 3.04 | 1.96 | 2.00 | 1.85 | 3.28 | 1.87 |
| = Free cash flow | 480,790 | 98,638 | 515,991 | 248,075 | 230,686 | 60,699 | 566,266 | 170,052 |
What this means. The August 2026 results include one-time tariff refunds and other unusual items, so they may look better than the company's normal business.
What should Williams-Sonoma watch in its next results?
MarketBeat estimates November 18, 2026 as the next earnings date, though the date is not confirmed by the company. The key comparison is sales momentum against the raised annual outlook. Strong sales will mean more if WSM avoids heavier discounting and inventory does not accumulate faster than demand.