Williams-Sonoma dividend: payout and cash coverage
MyStockButler's October 2026 analysis: Williams-Sonoma pays US$0.76 per share each quarter, after raising its regular quarterly dividend from US$0.66 per share. In the year ending February 2026, Williams-Sonoma paid shareholders US$1,170,446 thousand against US$1,055,451 thousand of free cash flow, so the payout exceeded that year's generation.
How much does Williams-Sonoma pay per share?
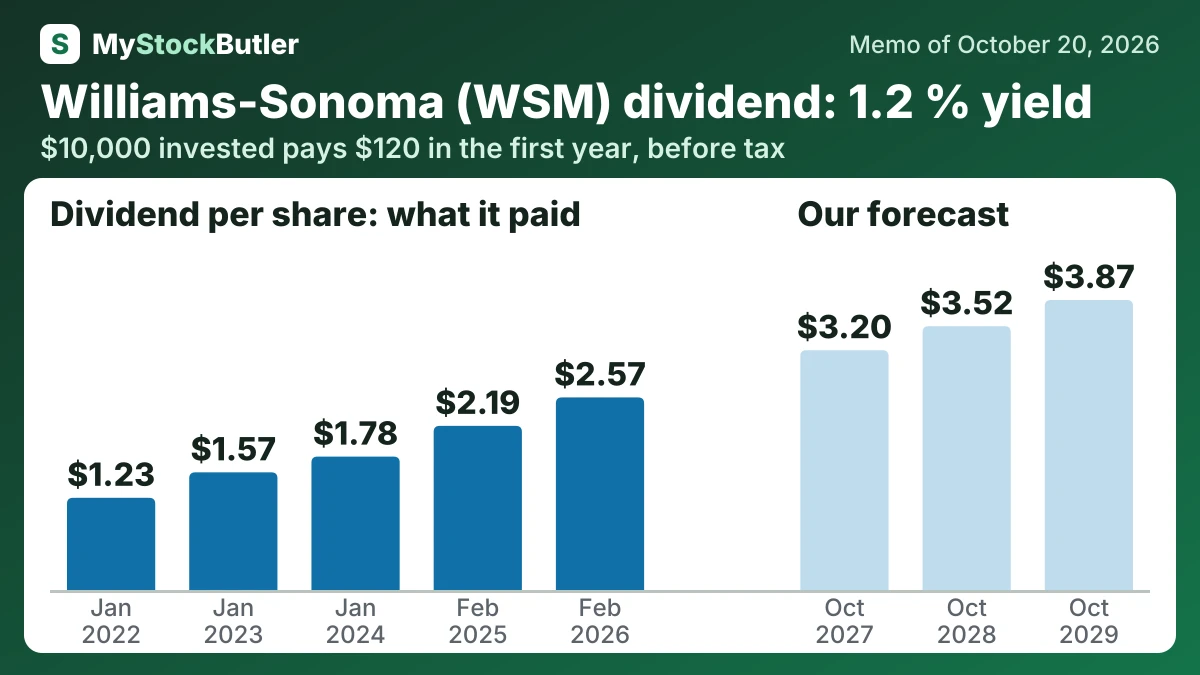
WSM authorized another US$1.0 billion of repurchases in November 2025, yet bought no shares in the second quarter of fiscal 2026. Dividends create a different commitment: on March 18, 2026, WSM raised its regular quarterly dividend from US$0.66 to US$0.76 per share.
| Feb 2026 | Feb 2025 | Jan 2024 | Jan 2023 | Jan 2022 | |
|---|---|---|---|---|---|
| EPS, diluted | 8.84 | 8.79 | 7.28 | 8.16 | 7.38 |
| Real free cash flow per share | 7.71 | 8.12 | 10.78 | 4.40 | 6.87 |
| − Dividends paid, per share | 2.57 | 2.19 | 1.78 | 1.57 | 1.23 |
| − Share buybacks, per share | 6.93 | 6.31 | 2.40 | 6.37 | 5.89 |
What this means. In February 2026, the company paid shareholders 0.93 dollars per share more than the cash its business generated after equipment spending.
How much would Williams-Sonoma's dividend pay you?
$10,000 invested in Williams-Sonoma at its 1.2% dividend yield (our report of October 20, 2026) pays $120.00 in the first year, before tax. If its dividend per share keeps changing 20.2% a year, as it did from Jan 2022 to Feb 2026, and the dividends are reinvested, year 10 pays $807.04, with $3,619.96 received in all.
Before tax. Past dividend growth is not a promise. Information only, not investment advice.
Is Williams-Sonoma's dividend covered by its cash?
The latest payout drew on earlier savings. In the year ending January 2024, WSM distributed 36.6% of free cash flow and retained US$946,339 thousand before other cash movements. In the year ending February 2026, it paid shareholders US$1,170,446 thousand against US$1,055,451 thousand of free cash flow. That was 110.9%, or US$114,995 thousand more than that year’s generation.
| Feb 2026 | Feb 2025 | Jan 2024 | Jan 2023 | Jan 2022 | |
|---|---|---|---|---|---|
| Free cash flow | 1,055,451 | 1,138,655 | 1,491,815 | 698,705 | 1,144,630 |
| − Dividends paid | 316,484 | 280,058 | 232,475 | 217,345 | 187,539 |
| − Share buybacks | 853,962 | 807,477 | 313,001 | 880,038 | 899,433 |
| = Free cash flow not paid out | 51,120 | 946,339 | 57,658 | ||
| = Paid out more than the free cash flow | 114,995 | 398,678 | |||
| Paid to shareholders | 1,170,446 | 1,087,535 | 545,476 | 1,097,383 | 1,086,972 |
What this means. In some years, the company paid shareholders more cash than it generated, using money saved in the bank rather than new borrowing.
What could change Williams-Sonoma's dividend?
The takeaway is a business with a smaller share base and a substantial cash cushion after reinvestment and distributions. The test ahead is whether recurring cash generation can support the higher dividend while preserving room for useful investment and disciplined buybacks.
Dividends rise from $3.20 per share to $3.52 and then $3.87 in the base case. The increases moderate from the company’s five-year record because buybacks and dividends already exceeded free cash flow in fiscal 2025. The bear case uses $3.04 first, then cuts to $2.64 and holds there. The bull case reaches $3.36, $3.86 and $4.44 as cash generation remains strong.
| October 2027 | October 2028 | October 2029 | |
|---|---|---|---|
| Normal operating profit | 1,479 (1,240 / 1,530) | 1,531 (1,170 / 1,620) | 1,584 (1,240 / 1,702) |
| Shares (millions) | 116 (117 / 115) | 114 (116 / 113) | 112 (114 / 111) |
| Dividends per share | 3.20 (3.04 / 3.36) | 3.52 (2.64 / 3.86) | 3.87 (2.64 / 4.44) |
| Net debt | -997 (-1,083 / -845) | -923 (-1,135 / -630) | -806 (-1,243 / -370) |
What this means. Negative net debt means the company has more cash than borrowed money.
What is Williams-Sonoma's dividend yield today?
At its current price, Williams-Sonoma is a test of how much confidence investors can place in a profitable home-furnishings retailer. The central question is not whether it earns money, but how much growth, durability and cash generation the price already assumes.