Verisign stock forecast 2027–2029
MyStockButler's October 2026 analysis: Verisign’s weighted price outlook is $302.60 in October 2027, $315.48 in October 2028 and $331.06 in October 2029. It hinges on durable renewals, fee increases and cash returns that preserve financial flexibility.
Where could Verisign’s shares be in the forecast?
The forecast gives Verisign’s shares modest probability-weighted gains, but with substantial downside and upside around the central path. The weighted price is $302.60 in October 2027, roughly flat including dividends, then $315.48 in October 2028, a 6% return, and $331.06 in October 2029, a 12% return.
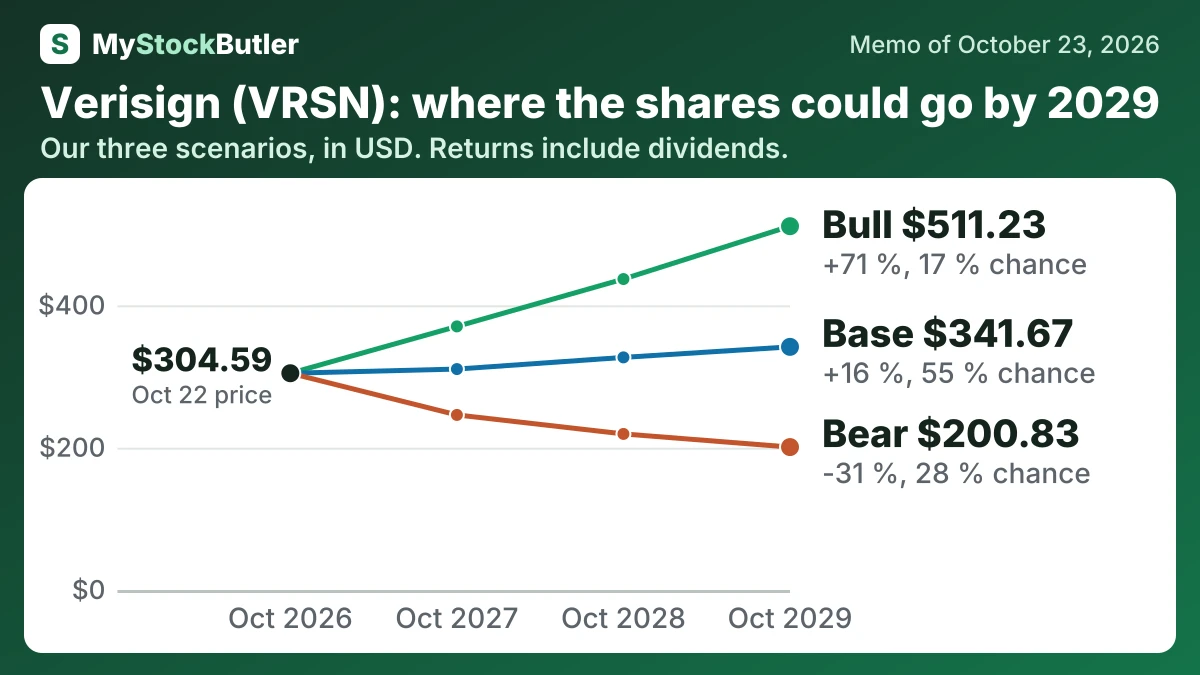
| Case | Probability | October 2027 | October 2028 | October 2029 |
|---|---|---|---|---|
| Bear | 28 % | 246.00 (-18 %) | 219.30 (-26 %) | 200.83 (-31 %) |
| Base | 55 % | 310.45 (+3 %) | 326.89 (+10 %) | 341.67 (+16 %) |
| Bull | 17 % | 370.41 (+23 %) | 436.98 (+46 %) | 511.23 (+71 %) |
| Weighted | 100 % | 302.60 (+0 %) | 315.48 (+6 %) | 331.06 (+12 %) |
What has to go right for Verisign?
The base follows revenue of $1,850 million, $1,960 million and $2,070 million, with net margins of 49%, 49.2% and 49.3%. It reflects guidance for about $1.8 billion of revenue and $1.2 billion of operating income, a domain base up 6.1% year over year, and fee increases beginning in late 2026. The bear assumes weaker renewals reduce margins from 48% to 46%, while the bull assumes durable renewals,.web and early Informed revenue support margins from 50% to 51%.
| 2025 | 2024 | 2023 | 2022 | 2021 | |
|---|---|---|---|---|---|
| Revenue | 1,656.6 | 1,557.4 | 1,493.1 | 1,424.9 | 1,327.6 |
| Revenue growth | 6.4% | 4.3% | 4.8% | 7.3% | 4.9% |
| Operating margin | 67.7% | 67.9% | 67.0% | 66.2% | 65.3% |
| Real free cash flow, % of revenue | 60.3% | 52.2% | 50.1% | 52.3% | 52.8% |
| Net debt | 1,207.7 | 1,192.4 | 863.8 | 807.5 | 579.9 |
What this means. Operating margin is not the company’s final profit because it leaves out interest and taxes.
How much cash does Verisign really make?
Operating cash flow was $1,091.1 million in 2025. Capital spending was $22.8 million, leaving free cash flow of $1,068.3 million. Working capital released $121.5 million of cash in 2025, compared with $16.8 million in 2024. That timing benefit explained more than half of the annual increase. Removing it leaves growth of about 10.4%, rather than 22.2%.
Stock compensation is another economic deduction. Employees received $69.7 million in stock pay in 2025. Deducting it gives analytical “real free cash flow” of $998.6 million, which better reflects the value transferred to employees even though the payment did not leave the bank account.
| 2025 | 2024 | 2023 | 2022 | 2021 | |
|---|---|---|---|---|---|
| Cash from operations | 1,091.1 | 902.6 | 853.8 | 831.1 | 807.2 |
| − Capital spending | 22.8 | 28.1 | 45.8 | 27.4 | 53.0 |
| = Free cash flow | 1,068.3 | 874.5 | 808.0 | 803.7 | 754.2 |
| − Stock pay | 69.7 | 61.1 | 59.7 | 58.6 | 53.4 |
| = Real free cash flow | 998.6 | 813.4 | 748.3 | 745.1 | 700.8 |
| Real free cash flow, % of revenue | 60.3% | 52.2% | 50.1% | 52.3% | 52.8% |
What this means. The company's free cash flow is a tiny bit different from ours only because of rounding in its published numbers, not because it counts the money differently.
What does an investor pay for Verisign today?
The P/E ratio says how much investors pay for each dollar of earnings. Verisign’s trailing and forward multiples are close, which means the current price assumes only modest near-term earnings growth. Enterprise value adds debt and subtracts cash from market value, so it better reflects the claims on the operating business. Verisign’s EV-to-EBITDA multiple therefore asks investors to pay for a highly profitable operation while recognizing its net debt.