Verisign dividend
MyStockButler's October 2026 analysis: Verisign most recently raised its quarterly dividend to $0.81 per share, while free cash flow was $1,068.3 million. The memo treats the $2.31 dividend per share as sustainable only after infrastructure needs are funded.
How much does Verisign pay in dividends?
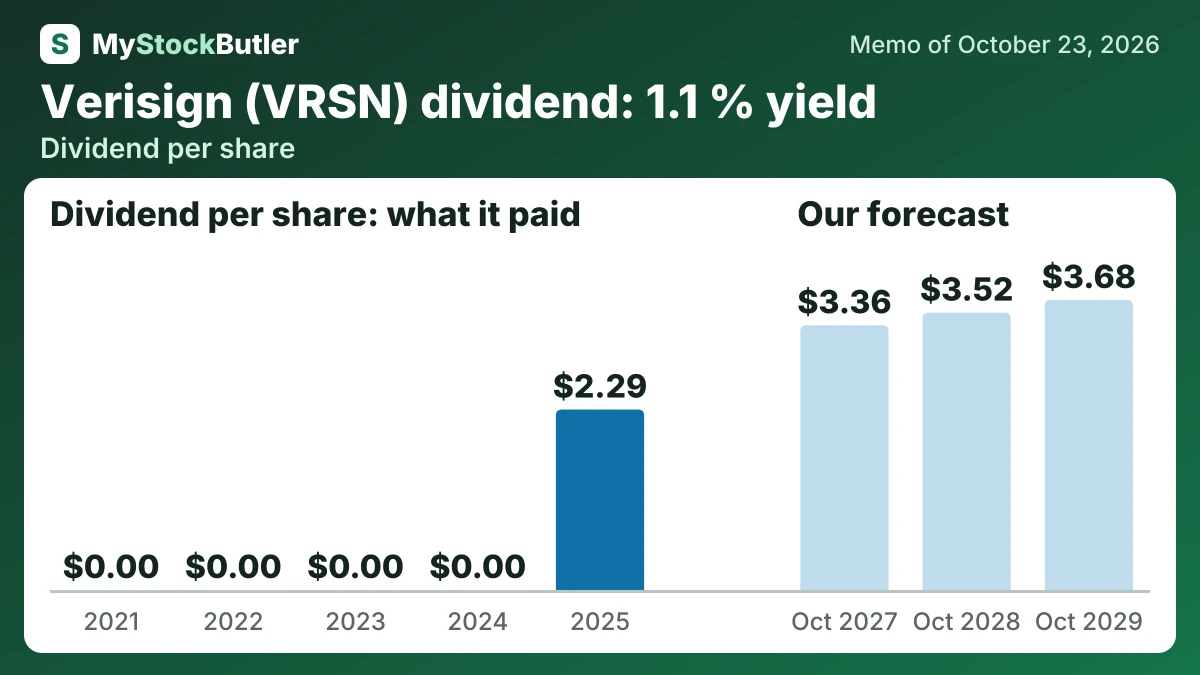
Verisign also moved from exceptional distributions to a recurring obligation. It began quarterly dividends in April 2025 at $0.77 per share. It raised the payment to $0.81 on February 3, 2026. That dividend now competes with buybacks, debt service and investment for the same cash.
| 2025 | 2024 | 2023 | 2022 | 2021 | |
|---|---|---|---|---|---|
| Revenue | 1,656.6 | 1,557.4 | 1,493.1 | 1,424.9 | 1,327.6 |
| EPS, diluted | 8.81 | 8.00 | 7.90 | 6.24 | 7.00 |
| Dividend per share | 2.31 | 0.00 | 0.00 | 0.00 | 0.00 |
What this means. Net income was unusually high in 2021 and 2023 because special tax benefits increased profit, not because the business itself earned much more.
Does Verisign's dividend come from its cash?
Operating cash flow was $1,091.1 million in 2025. Capital spending was $22.8 million, leaving free cash flow of $1,068.3 million. Working capital released $121.5 million of cash in 2025, compared with $16.8 million in 2024. That timing benefit explained more than half of the annual increase. Removing it leaves growth of about 10.4%, rather than 22.2%.
The low capital bill should not be treated as permanent. Management expects 2026 capital spending between $55 million and $65 million for replacement equipment, added capacity and headquarters improvements. The $2.31 dividend per share is sustainable only after those infrastructure needs, not because its yield looks attractive.
| 2025 | 2024 | 2023 | 2022 | 2021 | |
|---|---|---|---|---|---|
| Free cash flow | 1,068.3 | 874.5 | 808.0 | 803.7 | 754.2 |
| − Dividends paid | 215.2 | 0.0 | 0.0 | 0.0 | 0.0 |
| − Share buybacks | 858.6 | 1,209.3 | 882.8 | 1,032.2 | 700.0 |
| = Free cash flow not paid out | 54.2 | ||||
| = Paid out more than the free cash flow | 5.5 | 334.8 | 74.8 | 228.5 | |
| Paid to shareholders | 1,073.8 | 1,209.3 | 882.8 | 1,032.2 | 700.0 |
What this means. The company sometimes paid shareholders more cash than its business generated, making up the difference by selling investments or borrowing money.
What could change Verisign's dividend?
The base assumes annual increases near the company’s recent 5.2% raise. The bear reflects the short dividend history and the absence of a commitment, while the bull assumes stronger cash generation.
| October 2027 | October 2028 | October 2029 | |
|---|---|---|---|
| Earnings | 906 (874 / 950) | 964 (874 / 1,061) | 1,021 (869 / 1,178) |
| Shares (millions) | 87.60 (88.78 / 87.20) | 85.55 (87.70 / 84.94) | 83.63 (86.58 / 82.96) |
| Dividends per share | 3.36 (3.24 / 3.39) | 3.52 (3.24 / 3.64) | 3.68 (3.24 / 3.88) |
| Price to earnings | 30.00 (25.00 / 34.00) | 29.00 (22.00 / 35.00) | 28.00 (20.00 / 36.00) |
What is Verisign's dividend yield at today's price?
A required return is the reward investors demand for waiting and bearing risk. If investors demand a 10% annual return, the current cash yield leaves a substantial growth requirement. At today’s 3.9% yield, the simplified illustration implies about 5.9% annual cash growth forever. That is not a forecast; it shows why flat cash flow would make the price difficult to defend.