Unilever earnings: guidance and results
MyStockButler's October 2026 analysis: Unilever reports stronger demand alongside mixed profit and cash. Watch whether Brazil shipment changes reflect retailer inventory adjustments or weaker household demand.
What has Unilever guided for 2026?
Management guides to 4.0%–6.0% underlying sales growth in 2026, including 3.0% underlying volume growth. It targets a 20.0% underlying operating margin and expects second-half underlying sales growth of 4.0%–5.0%, increasingly price-led. The scenarios assign 30% probability to the bear case, 50% to base and 20% to bull.
| Period | Low | High | Given on | |
|---|---|---|---|---|
| Underlying sales growth (USG), full year | Year to Dec 2026 | 4.0% | 6.0% | 28 July 2026 |
| Underlying sales growth (USG), second half | 6 months to Dec 2026 | 4.0% | 5.0% | 28 July 2026 |
| Underlying volume growth | Year to Dec 2026 | 3.0% | 3.0% | 28 July 2026 |
| Underlying operating margin (UOM) | Year to Dec 2026 | 20.0% | 28 July 2026 |
Did Unilever keep its past promises?
His first major organisational test was the ice-cream separation. On 6 December 2025, Unilever completed the demerger of ice cream, including Magnum, into The Magnum Ice Cream Company. A demerger gives a business its own management, accounts, shares and listing, so shareholders can judge it separately. Completing the separation proves that management delivered a difficult project; it does not prove that either company will perform better.
What do the latest Unilever results show?
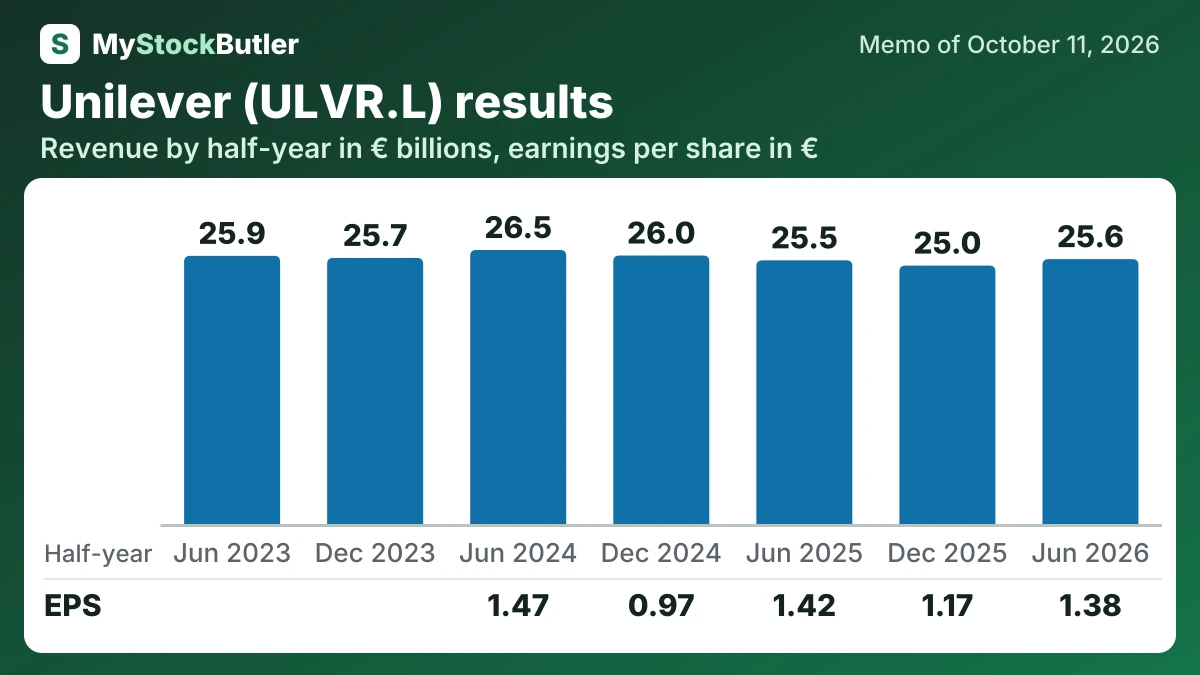
The half-year accounts give a mixed verdict. Operating income and cash flow improved, but gross margin, shareholder earnings and diluted EPS weakened. A specialist therefore sees a promising demand turn alongside less convincing product economics. Another period will show whether the volume survives without promotional support.
| 6 months to Jun 2026 | 6 months to Dec 2025 | 6 months to Jun 2025 | 6 months to Dec 2024 | 6 months to Jun 2024 | 6 months to Dec 2023 | 6 months to Jun 2023 | |
|---|---|---|---|---|---|---|---|
| Revenue | 25,623 | 24,997 | 25,506 | 25,972 | 26,507 | 25,738 | 25,942 |
| Gross margin | 46.8% | 47.5% | 47.3% | ||||
| Operating income | 4,885 | 4,275 | 4,762 | 3,478 | 5,351 | 4,126 | 4,872 |
| Net income | 3,024 | 2,557 | 3,125 | 2,143 | 3,287 | ||
| EPS, diluted | 1.38 | 1.17 | 1.42 | 0.97 | 1.47 |
What should Unilever watchers look for next?
The first checkpoint is the 28 October 2026 third-quarter trading statement. Investors should separate price from volume, especially in Brazil. A shipment slowdown could reflect retailers reducing inventories before the January 2027 tax change rather than households abandoning OMO or Dove. Sell-through will show which explanation is stronger.