TSMC dividend: history, cash cover and yield
MyStockButler's October 2026 analysis: TSMC's annual dividends rose from 11 in 2021–22 to 22 in 2025, and the 2026 target is 24. TSMC's net cash increased across the five years through 2025 even as dividends rose, although heavy investment remains the main claim on cash.
How much does TSMC pay per share?
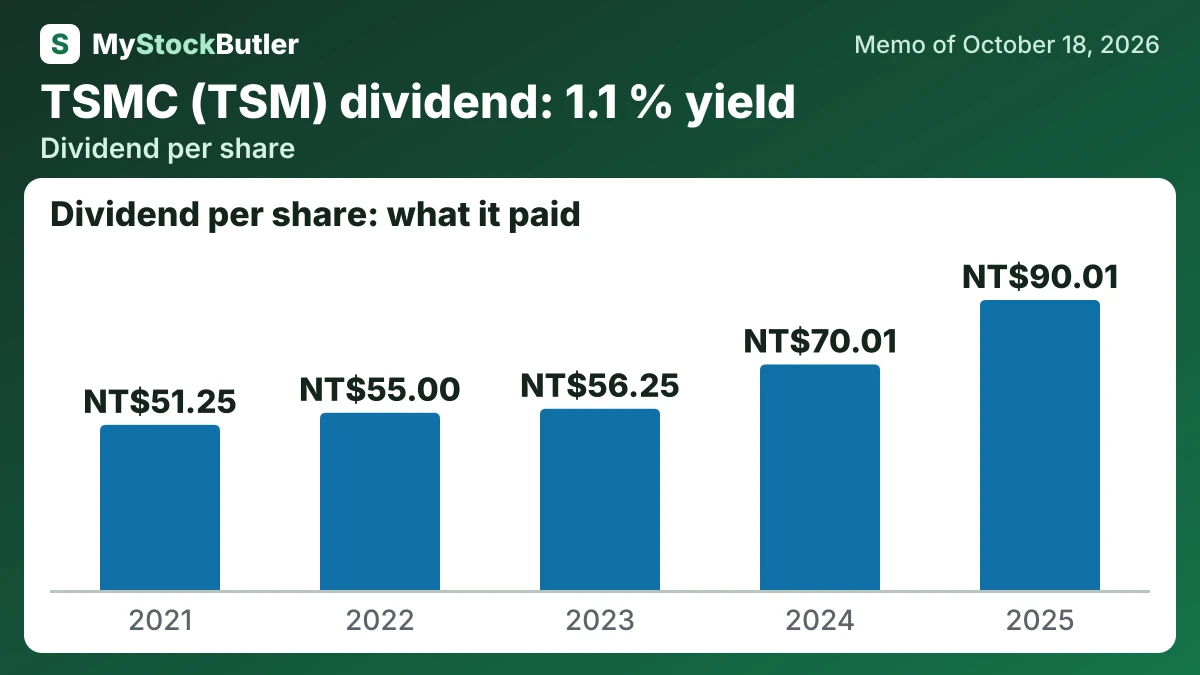
Base dividends per share are 28 in 2027 and 32 in 2028. They reach 36 in 2029. The bear holds the annual rate at 28, while the bull reaches 44 by 2029. Annual dividends rose from 11 in 2021–22 to 22 in 2025, and the 2026 target is 24. The policy of steadily increasing dividends supports the base case, but heavy investment justifies the bear case.
| 2025 | 2024 | 2023 | 2022 | 2021 | |
|---|---|---|---|---|---|
| Net income | 1,697,604.0 | 1,158,380.2 | 851,740.0 | 992,923.4 | 592,359.2 |
| EPS, diluted | 327.34 | 223.37 | 164.24 | 191.46 | 114.22 |
| Dividend per share | 110.00 | 85.00 | 65.00 | 55.00 | 55.00 |
Does TSMC's cash cover its dividend?
TSMC has mainly directed its cash toward factories and dividends while keeping a growing reserve. Free cash flow is the money left after operating costs and factory investment. Management can then retain it, pay shareholders, repay debt, or invest further.
| 2025 | 2024 | 2023 | 2022 | 2021 | |
|---|---|---|---|---|---|
| Free cash flow | 1,002,565.1 | 870,170.6 | 292,150.5 | 527,927.1 | 272,965.0 |
| − Dividends paid | 466,779.2 | 363,055.2 | 291,721.9 | 285,234.2 | 265,786.4 |
| − Share buybacks | 0 | 3,089.2 | 0 | 871.6 | 0 |
| = Free cash flow not paid out | 535,785.9 | 504,026.2 | 7,063.6 | ||
| Paid out, % of free cash flow | 46.6% | 42.1% | 99.9% | 54.2% | 97.4% |
What this means. The company's own net cash is almost the same as our calculation; the small difference comes from what each count includes and rounding.
What could change TSMC's dividend?
| October 2027 | October 2028 | October 2029 | |
|---|---|---|---|
| EBITDA | 4,500,000 (4,060,000 / 4,884,000) | 5,475,000 (3,575,000 / 6,080,000) | 6,512,000 (4,020,000 / 7,392,000) |
| Dividends per share | 28.00 (28.00 / 28.00) | 32.00 (28.00 / 36.00) | 36.00 (28.00 / 44.00) |
| Net debt | -3,793,000 (-3,666,800 / -3,972,000) | -5,242,000 (-4,289,000 / -5,582,000) | -7,384,000 (-5,244,000 / -7,918,000) |
What this means. A negative net debt number means the company has more cash than borrowed money.
What is TSMC's dividend yield today?
Price-to-book shows the value assigned to TSMC’s recorded industrial assets, but not fully to its process knowledge or customer qualification. Free-cash-flow yield shows cash left after capital spending, yet one year can look weak simply because equipment bills arrived early. Dividend yield shows cash returned to shareholders, not the cash still needed for expansion.