Tractor Supply stock forecast 2027–2029
MyStockButler's October 2026 analysis: The weighted scenario reaches $35.84 in October 2029, with 53% probability for the base case. It hinges on transactions recovering, Nampa scaling and savings arriving without damaging service.
Where could Tractor Supply's shares be by 2029?
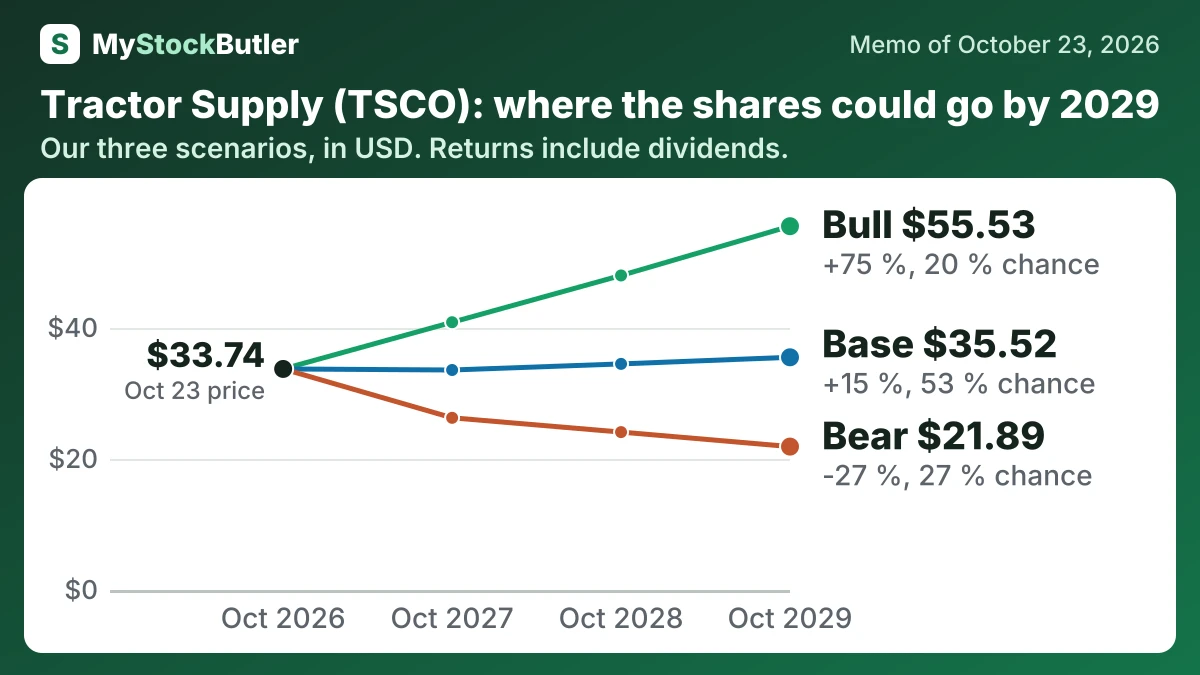
The range is much wider than the weighted path. By October 2029, the bear case gives $21.89 and the bull case gives $55.53. Today’s price is $33.74. The final probabilities are 27% bear, 53% base and 20% bull.
| Case | Probability | October 2027 | October 2028 | October 2029 |
|---|---|---|---|---|
| Bear | 27 % | 26.28 (-19 %) | 24.10 (-23 %) | 21.89 (-27 %) |
| Base | 53 % | 33.58 (+2 %) | 34.51 (+8 %) | 35.52 (+15 %) |
| Bull | 20 % | 40.87 (+24 %) | 48.01 (+49 %) | 55.53 (+75 %) |
| Weighted | 100 % | 33.06 (+1 %) | 34.40 (+8 %) | 35.84 (+15 %) |
What this means. The weighted row is the average value based on the chances of each case, not a promise that the shares will be worth that amount.
What has to go right, and what could go wrong for Tractor Supply?
The bear case gives earnings of $960 million in the first year and $935 million in the second, then $907 million. It assumes weak established-store demand, cost pressure and margins falling from 6.0% to 5.4%. The latest quarter still had transactions down 0.3%, while full-year comparable-sales guidance remains negative to flat. The bull case reaches $1,092 million, $1,194 million and $1,288 million as transactions recover, Nampa scales and savings arrive without damaging service. That requires more than the current evidence supports.
How much cash does Tractor Supply really make?
Profit records sales and costs when accounting rules recognise them; cash records when money enters or leaves the bank. Free cash flow subtracts capital spending from operating cash, so it tests whether reported earnings are funding the stores, technology and distribution capacity the business needs.
Stock compensation is another distinction. It does not consume cash when recorded, but it gives employees an economic claim on the company. Deducting it produces a more owner-oriented cash measure, though not a standard accounting subtotal.
| 2025 | 2024 | 2023 | 2022 | 2021 | |
|---|---|---|---|---|---|
| Cash from operations | 1,635,259 | 1,420,835 | 1,334,033 | 1,356,979 | 1,138,720 |
| − Capital spending | 894,770 | 784,047 | 753,883 | 773,369 | 628,431 |
| = Free cash flow | 740,489 | 636,788 | 580,150 | 583,610 | 510,289 |
| − Stock pay | 57,063 | 48,367 | 57,015 | 53,832 | 47,649 |
| = Real free cash flow | 683,426 | 588,421 | 523,135 | 529,778 | 462,640 |
| Real free cash flow, % of revenue | 4.4% | 4.0% | 3.6% | 3.7% | 3.6% |
What this means. Stock pay is subtracted even though no cash left because giving employees shares reduces current owners’ share of the company.
What does an investor pay for Tractor Supply today?
The stock trades at 18.1x its last twelve months’ earnings. That price is meaningful because earnings must support inventory, stores and distribution before they can support shareholders. Free cash flow, the cash left after capital spending, offers a sterner test. Its stated yield is 4.2%, while the separately calculated real free-cash-flow yield is 3.9%.
| Today (Oct 23, 2026) | |
|---|---|
| Share price | 33.7359 |
| P/E, last 12 months (calculated) | 18.1x |
| P/E, next 12 months (calculated) | 16.5x |
| Free cash flow yield (calculated) | 4.2% |
| Real free cash flow yield (calculated) | 3.9% |
| Dividend yield (calculated) | 2.8% |
What this means. Enterprise value is higher than market value because it adds the company’s debt and subtracts its cash to show what it would cost to buy the whole business.