Regency Centers earnings
MyStockButler's October 2026 analysis: Regency Centers is scheduled to report results on November 5, 2026. For Regency Centers, watch whether commenced occupancy turns signed leases into recurring rent.
What has Regency Centers guided for the year?
On July 29, management raised its outlook for Nareit FFO and Core Operating Earnings. FFO adds back real-estate depreciation and removes property-sale gains and impairments, making recurring property performance easier to compare. Core Operating Earnings removes selected non-cash and unusual items. Both are operating measures, not cash available for construction, interest or dividends; AFFO is the measure intended to come closer to that cash.
| Period guided | Low | High | Date given | |
|---|---|---|---|---|
| Net Income Attributable to Common Shareholders per diluted share | Year to Dec 2026 | 2.48 | 2.52 | Jul 29, 2026 |
| Nareit Funds From Operations (Nareit FFO) per diluted share | Year to Dec 2026 | 4.84 | 4.88 | Jul 29, 2026 |
| Core Operating Earnings per diluted share | Year to Dec 2026 | 4.62 | 4.66 | Jul 29, 2026 |
| Same property NOI growth | Year to Dec 2026 | 3.7% | 4.1% | Jul 29, 2026 |
What this means. The low and high being the same does not mean the result is guaranteed; it means the company gave one approximate estimate.
Has Regency Centers kept its promises?
Regency’s record supports confidence, with all three earnings measures exceeding their opening guidance across the five years reviewed. Net-income guidance was cut in November 2023. Net income finished below final guidance in 2021 and 2024, partly because impairments can reduce accounting profit without reducing FFO.
| What management forecast | Checked | Above | Within | Below |
|---|---|---|---|---|
| Nareit Funds From Operations (“Nareit FFO”) per diluted share | 5 years | 5 | 0 | 0 |
| Core Operating Earnings per diluted share | 5 years | 5 | 0 | 0 |
| Net Income Attributable to Common Shareholders per diluted share | 5 years | 5 | 0 | 0 |
What do Regency Centers results show?
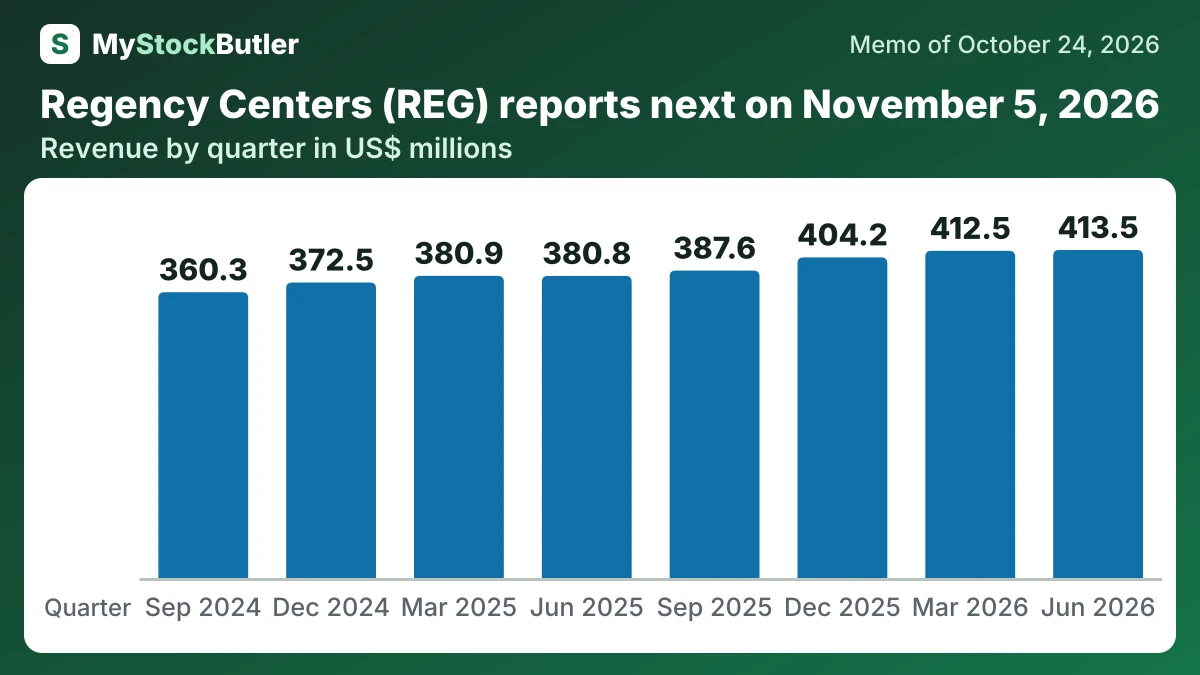
Quarterly revenue reached $413.510 million, up 8.6% from June 2025. NOI reached $300.106 million, up 6.8%. FFO per share rose to $1.21, an increase of 4.3%.
| Jun 2026 | Mar 2026 | Dec 2025 | Sep 2025 | Jun 2025 | Mar 2025 | Dec 2024 | Sep 2024 | |
|---|---|---|---|---|---|---|---|---|
| Revenue | 413,510 | 412,453 | 404,194 | 387,570 | 380,848 | 380,912 | 372,536 | 360,266 |
| Net operating income | 300,106 | 296,394 | 287,102 | 281,868 | 280,933 | 273,538 | 264,878 | 261,160 |
| FFO per share | 1.21 | 1.20 | 1.17 | 1.15 | 1.16 | 1.15 | 1.09 | 1.07 |
| Core Operating Earnings per share | 1.16 | 1.16 | 1.12 | 1.09 | 1.10 | 1.09 | 1.04 | 1.03 |
| Dividend per share | 0.76 | 0.76 | 0.76 | 0.71 | 0.71 | 0.71 | 0.71 | 0.67 |
| Occupancy | 96.5% | 96.2% | 96.1% | 96.0% | 96.2% | 96.3% | 96.3% | 95.6% |
What this means. The company’s own adjusted profit per share is different from funds from operations per share, so the dividend payout percentage uses the company’s number instead of the standard number shown above.
What should I watch in Regency Centers results?
First, watch commenced occupancy. The July upgrade relied partly on tenants beginning leases during the second half. Higher commenced occupancy and recurring rent would confirm that signed leases are becoming operating income; a gain driven mainly by expense recoveries would be less durable.
Finally, read financing details alongside the earnings headline. The strongest result would combine more commenced rent, completed projects and enough retained borrowing capacity to continue investing. That combination—not an isolated FFO beat—will determine what comes next for Regency Centers.