PPG earnings: January 26, 2027 results
MyStockButler's October 2026 analysis: PPG's next results are expected on January 26, 2027. Watch whether Industrial Coatings margins recover as prices catch up with costs.
What has PPG guided for 2026?
On October 27, PPG narrowed its full-year 2026 adjusted earnings-per-share forecast to $7.90–$8.10. In the third quarter of 2026, reported EPS was $2.12 and adjusted EPS was $2.25. Reported EPS includes every accounting cost. Adjusted EPS removes selected items that management says do not reflect normal operations, such as restructuring or acquisition costs. The roof repair still costs the household money, however, even if a “usual income” budget sets it aside.
PPG expects low-single-digit organic sales growth in the fourth quarter of 2026. Organic sales remove the effects of acquisitions, divestitures and currency, so they show how the existing business is growing. Aerospace, Latin American architectural coatings and packaging coatings are expected to lead. Full-year 2026 capital spending is guided to $650 million–$700 million.
| Period guided | Low | High | Date given | |
|---|---|---|---|---|
| Adjusted earnings per share | Year to Dec 2026 | 7.90 | 8.10 | Oct 27, 2026 |
| Capital Expenditures | Year to Dec 2026 | 650 | 700 | Jul 28, 2026 |
| Restructuring savings | Year to Dec 2026 | 50 | 50 | Jul 29, 2026 |
| Cash outlays related to restructuring actions | Year to Dec 2026 | 80 | 100 | Jul 29, 2026 |
| Organic sales growth, fourth quarter 2026 | Quarter to Dec 2026 | Oct 27, 2026 |
What this means. A basis point is one hundredth of a percentage point, so a 100-basis-point increase means the margin rises by one percentage point.
Did PPG keep its capital-spending promises?
The promise record is mixed. A five-year capital-spending check scored two forecasts above plan, two within plan and one below. PPG cut its 2025 adjusted-EPS outlook from $7.75–$8.05 to $7.60–$7.70, then reported $7.58. Comparisons also need care because PPG sold its U.S. and Canadian architectural-coatings business in 2024 and recast earlier results. A supermarket’s results after selling its bakery cannot be compared with earlier results as though the bakery were still there.
| What management forecast | Checked | Above | Within | Below |
|---|---|---|---|---|
| Capital expenditures | 5 years | 2 | 2 | 1 |
What this means. Management’s capital spending forecasts were close to the actual amounts in two of five years, higher than actual spending in two years, and lower in one year.
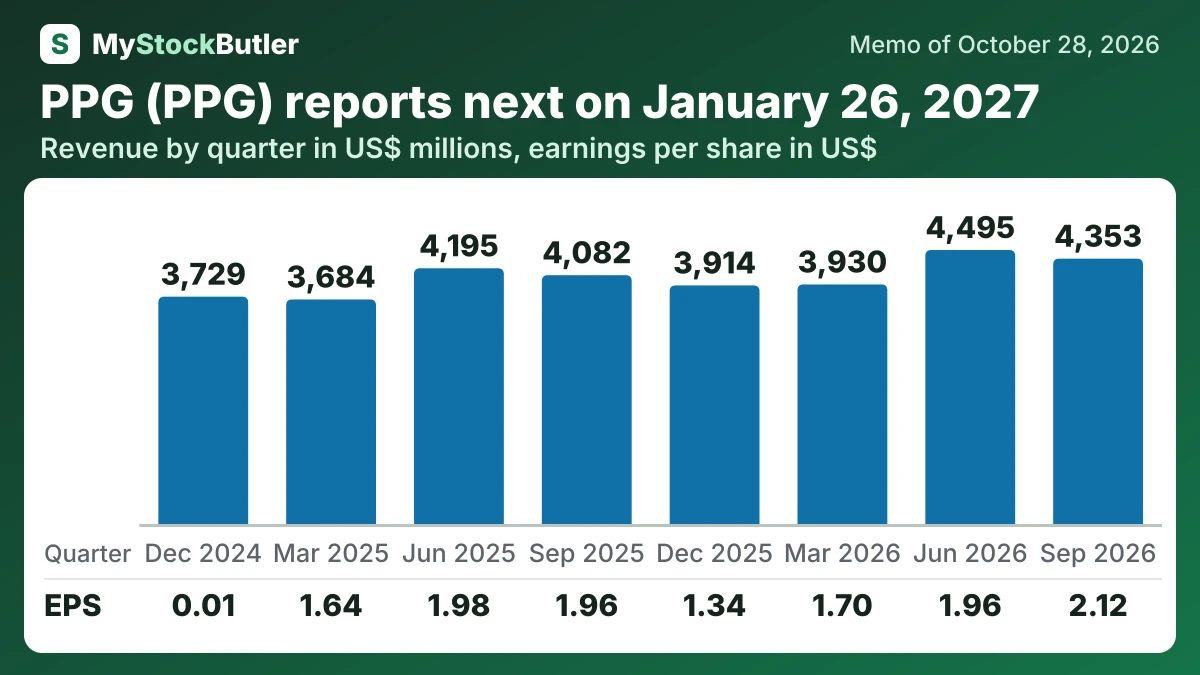
What have PPG's last eight quarters shown?
Organic sales rose 5%, extending the year-over-year growth streak to seven quarters. Prices contributed 3% and volumes 2%. Currency and acquisitions each added 1%. A sustained run of organic growth is more persuasive than one strong quarter, although the drivers still differ by business.
| Sep 2026 | Jun 2026 | Mar 2026 | Dec 2025 | Sep 2025 | Jun 2025 | Mar 2025 | Dec 2024 | |
|---|---|---|---|---|---|---|---|---|
| Revenue | 4,353 | 4,495 | 3,930 | 3,914 | 4,082 | 4,195 | 3,684 | 3,729 |
| Gross margin | 40.5% | 40.2% | 42.1% | 40.8% | 40.6% | 42.0% | 41.9% | 40.5% |
| Operating income | 653 | 598 | 541 | 423 | 579 | 616 | 515 | 96 |
| Income from continuing operations attributable to PPG | 473 | 439 | 382 | 302 | 444 | 450 | 375 | 2 |
| EPS, diluted | 2.12 | 1.96 | 1.70 | 1.34 | 1.96 | 1.98 | 1.64 | 0.01 |
| = Free cash flow | 411 | 448 | -163 | 588 | 529 | 266 | -225 | 127 |
What this means. Free cash flow can be negative even when the company brings in cash from daily work because it spent more on equipment and buildings than it generated.
What should you watch in PPG's next results?
When PPG reports the final quarter of 2026, investors should compare organic sales and earnings with guidance, then inspect operating cash and capital spending. Aerospace demand and recovering automotive-refinish sales could support Performance Coatings, but another industrial-margin decline would show that prices are still chasing costs.