Kraken stock forecast 2027–2029
MyStockButler's October 2026 analysis: Kraken's weighted price is C$3.94 in October 2027 and C$4.75 in October 2029, with 30% probability to bear, 50% to base and 20% to bull. It hinges on funded orders becoming accepted deliveries.
Where could Kraken's shares be by October 2029?
The weighted price is C$3.94 in October 2027 (-12%). It is C$4.75 in October 2029 (+6%). The forecast assigns 30% probability to bear and 50% to base. Bull has 20%.
The final-date range is wide: C$2.00 in the bear case to C$9.34 in the bull case. The bear receives 30% probability, the base 50%, and the bull 20%, because execution evidence supports growth but not yet smooth delivery or reliable cash conversion.
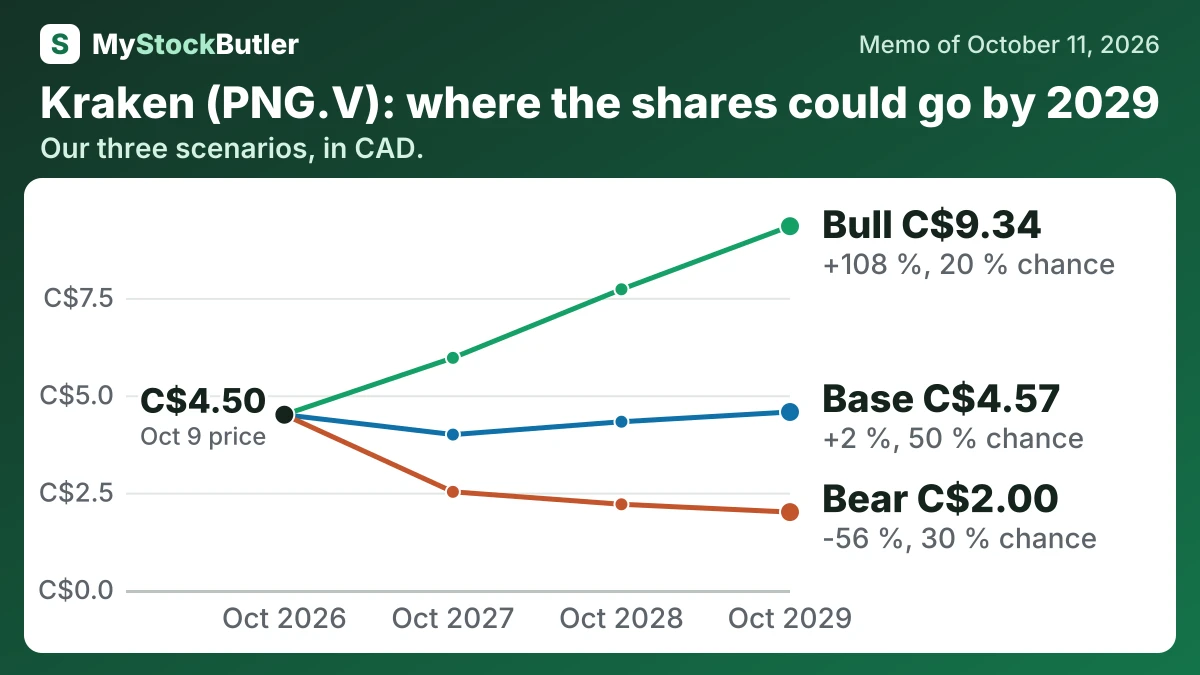
| Case | Probability | October 2027 | October 2028 | October 2029 |
|---|---|---|---|---|
| Bear | 30 % | 2.52 (-44 %) | 2.20 (-51 %) | 2.00 (-56 %) |
| Base | 50 % | 3.99 (-11 %) | 4.32 (-4 %) | 4.57 (+2 %) |
| Bull | 20 % | 5.96 (+32 %) | 7.72 (+72 %) | 9.34 (+108 %) |
| Weighted | 100 % | 3.94 (-12 %) | 4.37 (-3 %) | 4.75 (+6 %) |
What has to go right or wrong for Kraken's forecast?
The bear case gives C$61.25M at the first date and C$57M one year later. Its final figure is C$55M because delayed awards, weak Covelya performance and integration costs outweigh modest growth. The bull case starts at C$90.75M and reaches C$112M, then C$130M, if funded orders, repeat demand, cross-selling and the battery ramp arrive together.
The bull case requires funded orders to become accepted deliveries, repeat KATFISH and battery demand, successful cross-selling and a factory ramp with acceptable yield. By the final date, stronger collections and repeat orders justify both higher EBITDA and a premium multiple. The shares reach C$5.96 initially and C$9.34 finally, a 20% probability because several linked outcomes remain unproven at scale.
| October 2027 | October 2028 | October 2029 | |
|---|---|---|---|
| EBITDA | 76.50 (61.25 / 90.75) | 87.00 (57.00 / 112) | 96.00 (55.00 / 130) |
| Shares (millions) | 372 (374 / 372) | 374 (381 / 373) | 376 (388 / 375) |
| Enterprise value to ebitda | 18.00 (14.00 / 23.00) | 17.00 (13.00 / 24.00) | 16.00 (12.00 / 25.00) |
| Net debt | -108 (-87.70 / -128) | -139 (-99.20 / -183) | -183 (-117 / -252) |
How much cash does Kraken really make?
Kraken’s central weakness is that adjusted profit has not yet become dependable free cash flow.
| 2025 | 2024 | 2023 | 2022 | 2021 | |
|---|---|---|---|---|---|
| Cash from operations | 1,489 | -11,590 | 8,427 | 5,237 | -11,006 |
| Of which, tied up in working capital | 18,568 | 30,657 | 2,598 | 11,682 | |
| − Capital spending | 30,293 | 5,149 | 7,557 | 5,144 | 5,533 |
| = Free cash flow | -32,990 | -19,455 | -937 | -1,330 | -17,696 |
| − Stock pay | 2,342 | 948 | 378 | 797 | 433 |
| = Real free cash flow | -35,332 | -20,403 | -1,315 | -2,127 | -18,129 |